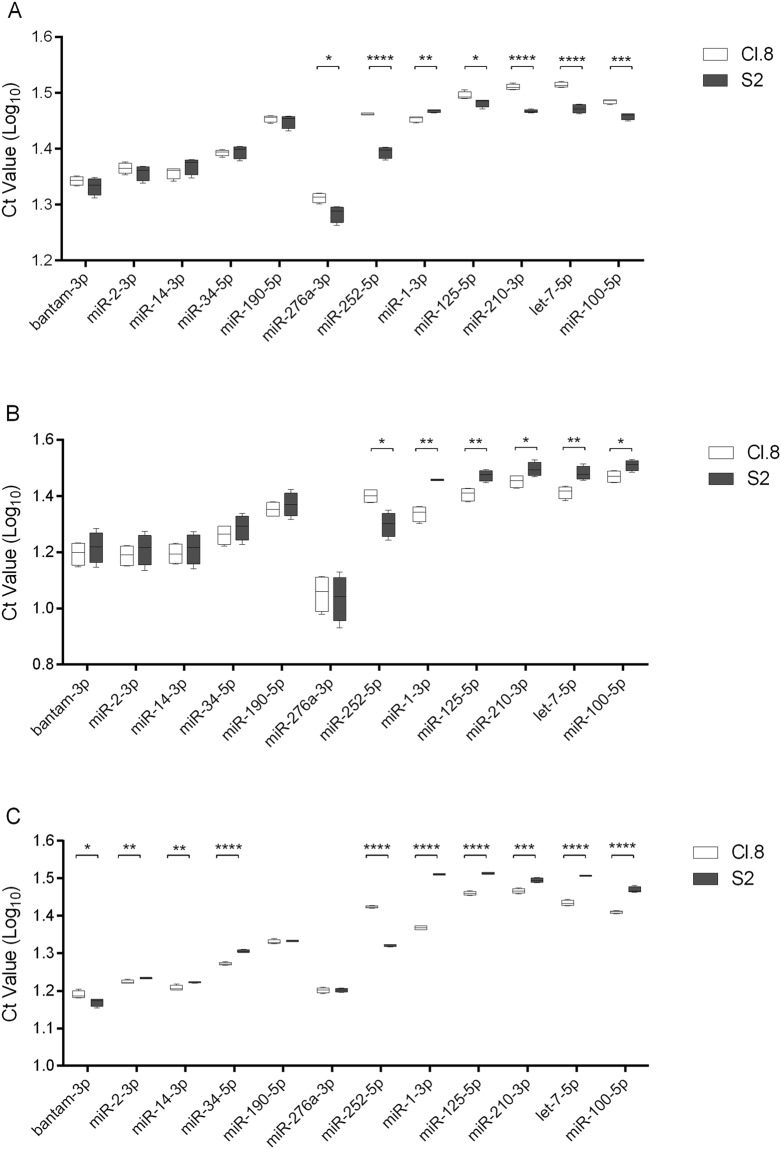
Figure 2.
qRT-PCR data for microRNAs detected in extra- and intracellular fractions of Cl.8 and S2 cell lines. (A) Extracellular vesicles (EVs) and (B) extracellular Ago-1 containing immunoprecipitates (EAgo-1) were isolated from the cell-free conditioned media of Cl.8 and S2 cell cultures and different miRNAs were detected using qRT-PCR. (C) The intracellular expression levels of the selected miRNAs were measured as well. The data (log10 Ct values) are shown as box plots (min to max with the rectangle spanning the first to the third quartile including median) of four biological replicates, run in duplicate. Statistical analyses were performed with GraphPad Prism 6 (Graphpad Software Inc.). Significant differences (p < 0.05, p < 0.01, p < 0.001 and p < 0.0001) between the data obtained for specific miRNAs in the extracellular media of the two cell lines were found, after a log transformation, via a t-test (with or without two-sided Welch’s correction) and are indicated by (an) asterisk(s) (*, **, *** and **** respectively).

