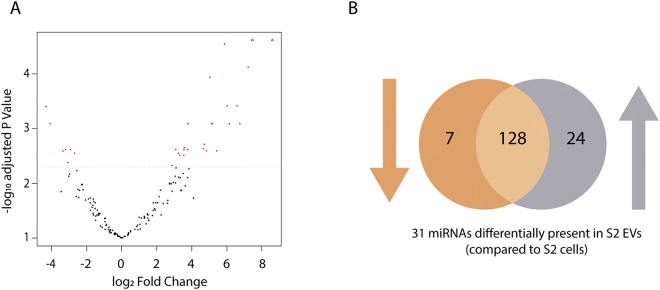
Figure 3.
Differentially expressed miRNAs as measured in small RNA-seq data of S2 cells and derived EVs. Differential expression analysis was performed using edgeR on three biological replicates of both groups. MiRNAs were retained with a CPM above 1 in at least 3 samples. (A) Volcano plot indicating 31 significantly different miRNAs in S2 cells and EVs (red dots) and (B) the corresponding Venn diagram presenting the amount of miRNAs with increased (24) or decreased (7) abundance in S2 EVs compared to S2 cells. Abbreviations: EV: extracellular vesicle.

