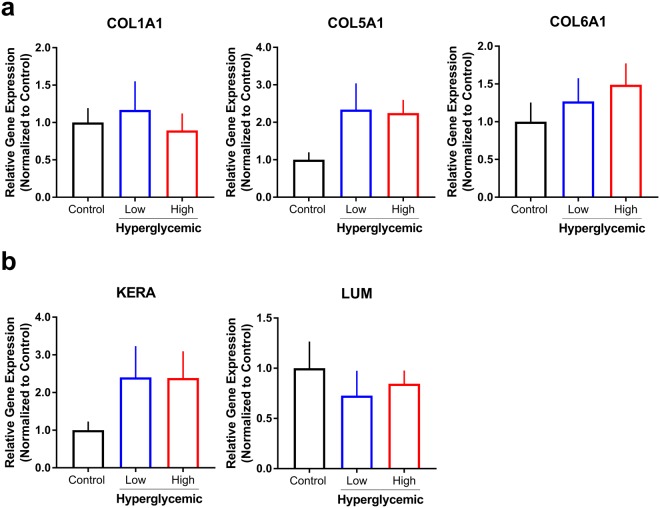
Figure 3.
Effects of hyperglycemia on gene and protein expression at day 42 following co-culture. Low (35 mM) and high (45 mM) glucose conditions were evaluated. Relative gene expression of (a) collagens (COL1A1), V (COL5A1), and VI (COL6A1), and (b) proteoglycans keratocan (KERA) and lumican (LUM) by stromal hCSSCs was determined using the ddCt method normalized to control (standard euglycemic media) with18S used as the housekeeping gene. n = 3–5.

