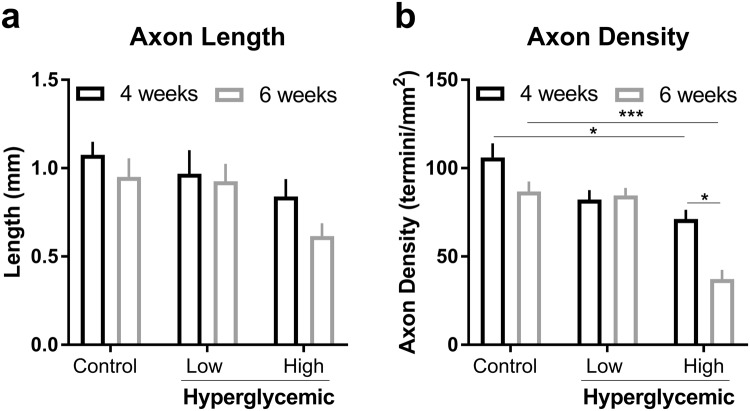
Figure 5.
Quantification of length (a) and density (b) of axons in day 28 and day 42 co-culture under high glucose concentrations for 14 days using 10X confocal images. Data was collected from n = 3 samples per condition and 5 regions per scaffold. Measurements and densities were determined using the ImageJ software plugin NeuronJ. Standard deviation is indicated as error bars for each group. *p < 0.05, **p < 0.005 and ***p < 5E-6, one-way ANOVA with a post-hoc Tukey test.

