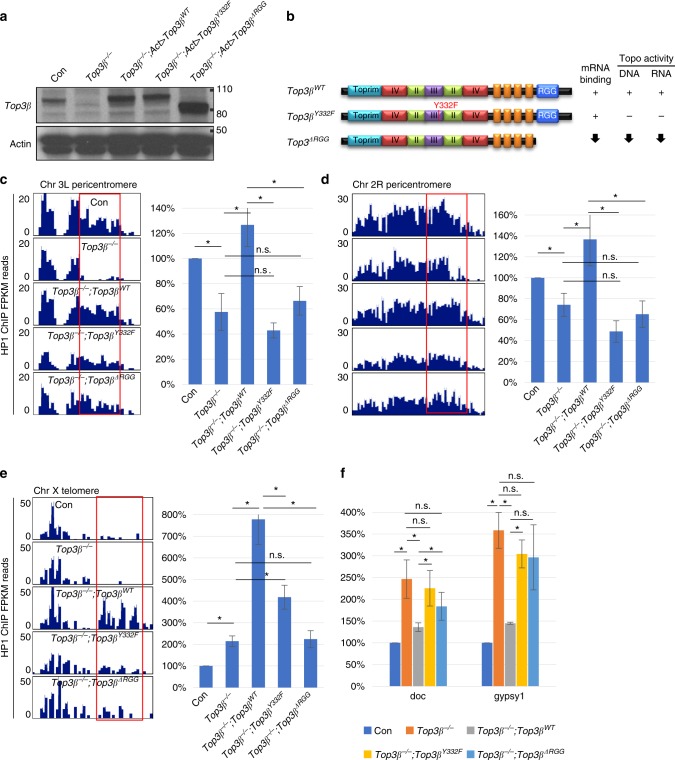
Fig. 8.
Top3β depends on both RNA-binding and catalytic activity to recruit HP1 to specific loci in heterochromatin and silence TEs. a Western blotting of Top3β complementation in fly heads. Each transgene (listed in b) was expressed by actin-gal4 driver in Top3β26 mutant background. b Schematic representation of the wildtype, the catalytic point mutant (Y332F), and the RGG-box deletion mutant (ΔRGG) of Top3β protein and their biochemical activities. The presence, absence, and reduction (arrow) of the activity are indicated. c Bedgraphs display HP1 ChIP-seq data at a representative locus in chromosome 3L pericentric region from the control flies (w1118), Top3β mutant (Top3β−/−), and the transgenic flies (Top3βWT, Top3βY332F, and Top3βΔRGG) that express wildtype and two mutants of Top3β, in the Top3β mutant background. The red box indicates the region selected for ChIP-qPCR analyses of HP1. The right graph shows the validation of the ChIP-seq by ChIP-qPCR analysis. d Same as c except that the representative locus is from pericentric heterochromatin of chromosome 2R. Note that the reduction of HP1 ChIP signals are significantly decreased in Top3β−/− as compared to control, and also in mutant complementation as compared to Top3βWT complementation (p < 0.05). e Bedgraphs displaying FPKM of ChIP-seq data show that HP1 signals are increased in Top3βWTcomplemented Top3β−/− mutant in the telomere locus in chromosome X. The graphs on the right panel represent ChIP qRT-PCR of the respective locus. Note that wildtype Top3β transgene (Top3βWT) resulted in the increase of HP1 recruitment in Top3β−/− mutant in chromosome X telomere, whereas the catalytic mutant and RNA binding mutant transgenes induced lower levels of HP1 as compared to Top3βWT. f A graph showing RT-qPCR of TE expression level in the control (w1118), Top3β−/−, Top3βWT, Top3βY332F, and Top3βΔRGG complemented mutant. RT-qPCR was performed in quadruplicates and TE levels were measured by normalizing with rp49. Statistics in c–f: “n.s.” indicates difference that is statistically not significant (p > 0.05); and asterisks indicate statistically significant difference with p-values less than 0.05 by Student T-test. The error bars represent standard errors

