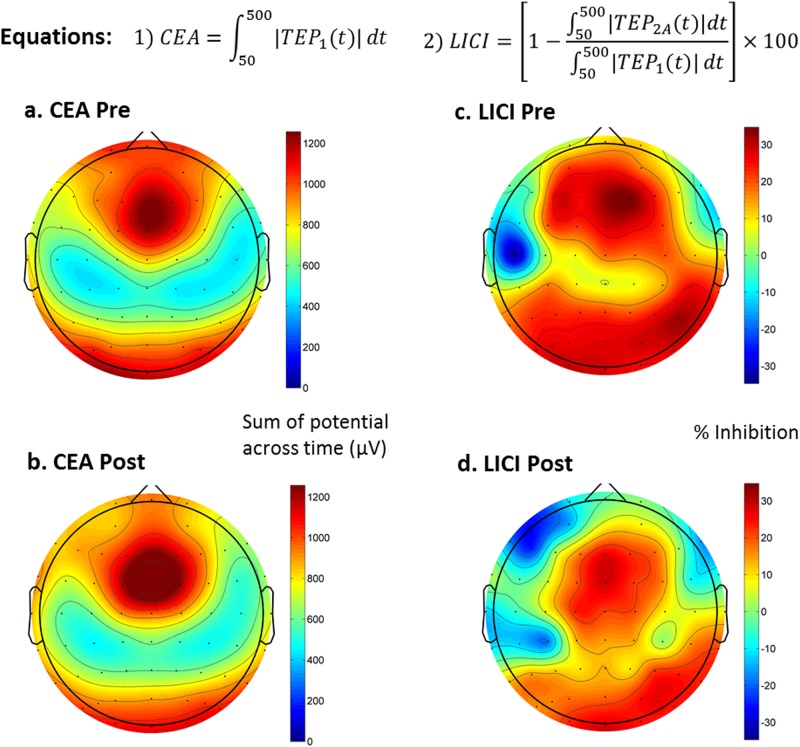
Fig. 1.
TMS-EEG measures of neuroplasticity and inhibition: cortical-evoked activity (CEA) was calculated using the single pulse TMS-evoked potential (TEP) in Eq. 1, while long-interval cortical inhibition (LICI) was calculated using both single and paired TEP in Eq. 2. Panels a and c show the baseline group average of the measures across all electrodes, while panels b and d show the post MST treatment group average of the same measures. The topoplots shown in this figure are all from the DLPFC condition. Please see Supplementary Fig. A1 for equivalent topoplots of the motor cortex condition

