Figure 4.
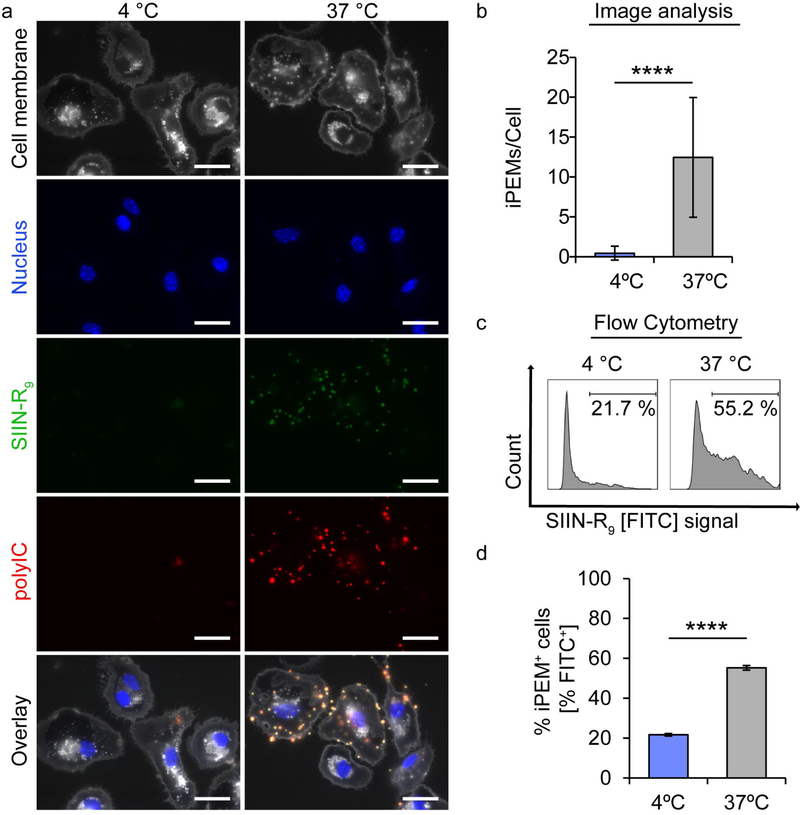
Energy dependent uptake of iPEMs by primary DCs. A) Fluorescent microcopy images of primary DCs incubated with iPEMs at 4°C and 37 °C shows that DCs require energy to take up iPEMs. Scale bar is 10μm. B) Images analysis quantitatively reveals a decrease in the number of iPEMs per cell when energy dependent processes are inhibited by incubating at 4°C. C) Representative flow cytometry plots and D) analysis of the percentage of cells positive for iPEM signal FITC from SIIN-R9 confirm a statistically significant decrease in iPEM uptake when energy dependent processes are inhibited. Error bars are standard deviation. Statistical analysis performed with one-way ANOVA with a Tukey post-test to correct for multiple comparison. **** = P≤0.0001.

