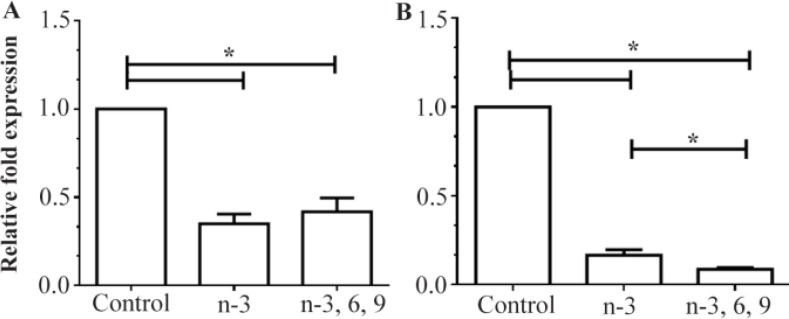
Figure 2.
Relative expression of DNMT3b in A) liver and B) colon tissue of rats fed with the n-3 PUFA and mixed PUFA supplemented diets measured by quantitative RT-PCR. The mean expression of each gene was normalized to β-actin mRNA. Water fed groups were used as controls, whose expression levels were set to 1.0, and expressions of n-3 PUFA and mixed PUFA supplemented groups were expressed as an n-fold difference relative to the control group. Mean values±SEM of three experiments are given. Bars marked with asterisk are significantly different as verified by Tukey’s honestly significant difference multiple comparison test (p<0.001).

