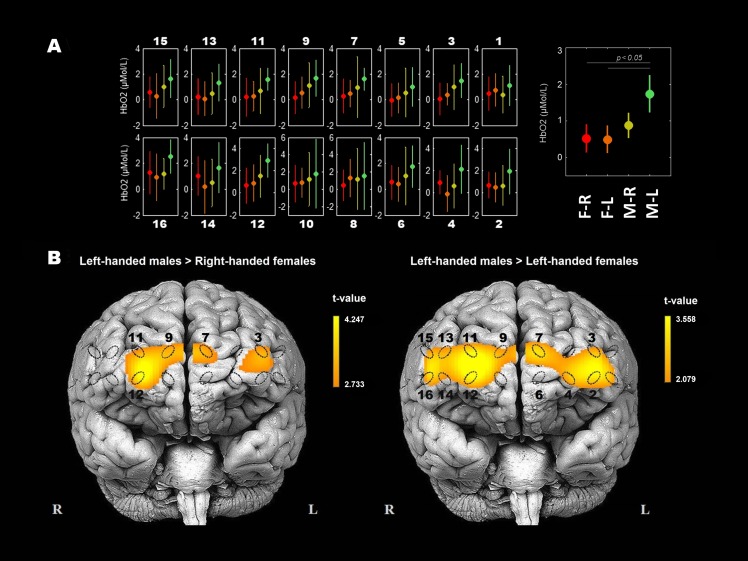
Figure 2. Spatial differences of HbO2 concentration between groups of participants during the WCST.
(A) Error plot of HbO2 mean (±SD) concentrations of HbO2 between participants’ groups in each of 16 optodes, and the mean (±SD) concentrations of HbO2 across optodes per group. Participants groups are: female right-handed, n = 20, F-R; female left-handed, n = 15, F-L; male right-handed, n = 20, M-R; male left-handed, n = 15, M-L). (B) Statistical activation maps (t-values, p < 0.05) display where the obtained HbO2 concentrations were significantly higher for left-handed males than right-handed females (t (33) = 3.039, p < 0.05) and left-handed females (t (28) = 3.230, p < 0.05). Significant optodes are outlined. Statistical values were spatially visualised using the BSpline18 interpolations method. The measured areas are marked with ellipses.

