Figure 1.
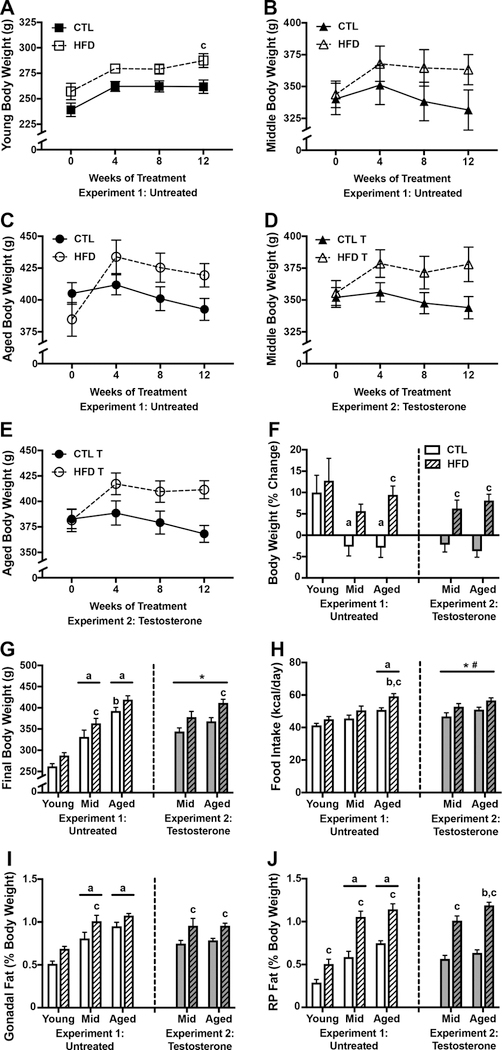
Body weight and adiposity outcomes associated with high fat diet in young, middle aged, and aged brown Norway rats. A-C) Body weights in A) young, B) middle-aged, and C) aged male brown Norway rats maintained on control and high fat diet taken at baseline (week 0) and 4-week intervals across the 12-week diet treatment. D-E) Body weights in testosterone treated D) middle-aged and E) aged rats fed control or high fat diet, across 12 weeks. F) Percent change in body weight from baseline to the end of the 12-week dietary treatment and G) final body weight, in young, middle-aged, and aged male brown Norway rats after 12 weeks of high fat diet-feeding. H) Food consumption as measured by the average daily kilocalories consumed across the 12-week dietary exposure. Adiposity is measured as weight of the I) gonadal fat pads and J) retroperitoneal fat pads, relative to total body weight. Data are presented as mean (±SEM) values; n=7–8/group. For figures A-E, young animals are shown as squares, middle-aged animals as triangles, and aged animals as circles; control diet are open symbols, high fat diet are closed symbols. For figures F-H, animals not treated with testosterone are shown in white (Experiment 1), and animals treated with testosterone in gray (Experiment 2); control diets are solid white or gray bars, high fat diets are striped bars. a p < 0.05 relative to young rats in same diet condition. b p < 0.05 relative to middle-aged animal in same diet condition. c p < 0.05 relative to control diet-fed of the same age. * p < 0.05 for main effect of age that does not reach statistical significance in post hoc tests. # p < 0.05 for main effect of diet that does not reach statistical significance in post hoc tests.

