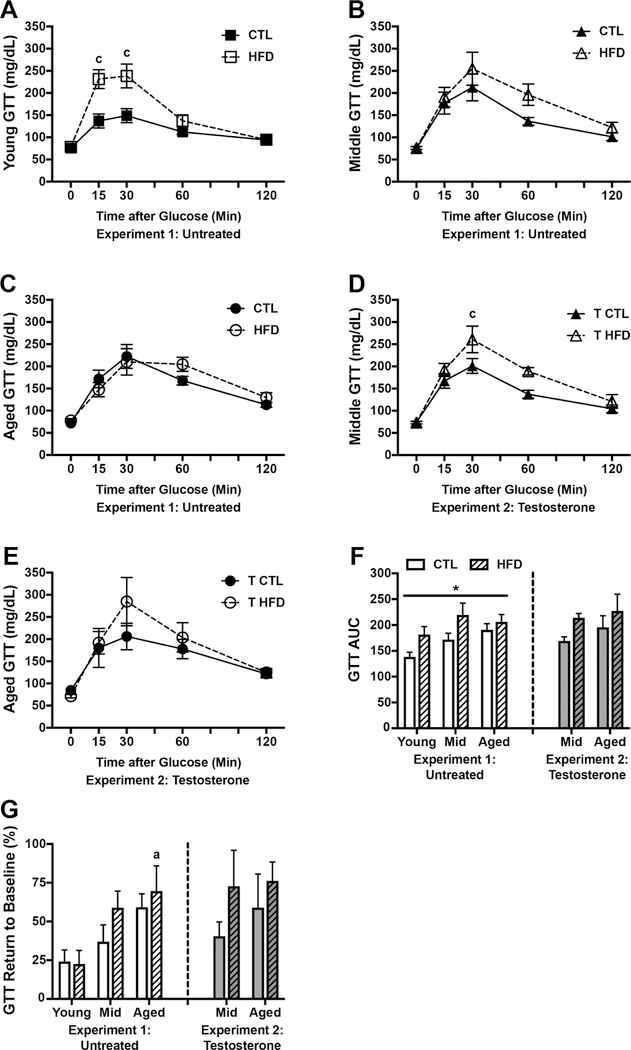
Figure 2.
Glucose homeostasis as assessed by glucose tolerance testing in young, middle aged, and aged brown Norway rats on control or high fat diet. A-C) Blood glucose levels measured in mg/dL at baseline (0 minutes) and 15, 30, 60, and 120 minutes after administration of a glucose bolus in A) young, B) middle-aged, and C) aged rats on control or high fat diet. D-E) Glucose levels in testosterone-treated D) middle-aged, and E) aged rats fed control or high fat diet and administered a glucose bolus. F) Area under the curve (AUC) for the glucose tolerance test. G) The extent to which animals returned to their baseline glucose levels after 120 min, calculated as a percent change from their baseline level. For figures A-E, young animals are shown as squares, middle-aged animals as triangles, and aged animals as circles; control diet are open symbols, high fat diet are closed symbols. For figures F-G, animals not treated with testosterone are shown in white (Experiment 1), and animals treated with testosterone in gray (Experiment 2); control diets are solid white or gray bars, high fat diets are striped bars. a p< 0.05 relative to young rats in same diet condition. c p < 0.05 relative to control diet-fed rats of the same age. * p < 0.05 for main effect of age that does not reach statistical significance in post hoc tests.

