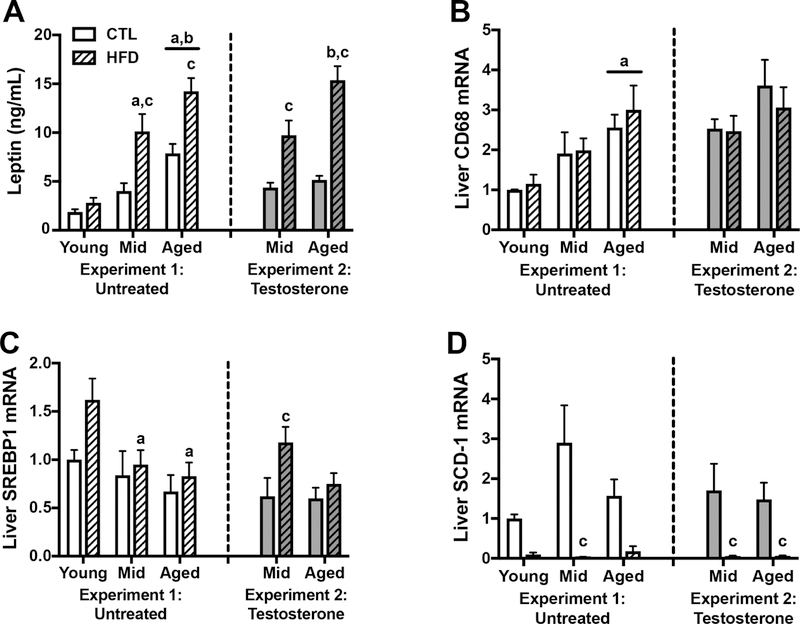
Figure 3.
Peripheral effects of control or high fat diet in young, middle-aged, and aged brown Norway rats. A) Plasma leptin levels measured in ng/mL in young, middle-aged, and aged rats on control or high fat diet, at the end of the experimental period. Relative mRNA expression in the liver of B) CD68, a macrophage marker; C) SREBP1, a transcription factor regulating lipogenesis and glycolysis; and D) SCD-1, a fatty acid metabolism enzyme, as determined by qPCR. Data show fold differences relative to the young rats on control diet. Animals not treated with testosterone are shown in white (Experiment 1), and animals treated with testosterone in gray (Experiment 2); control diets are solid white or gray bars, high fat diets are striped bars. a p< 0.05 relative to young rats in same diet condition. b p < 0.05 relative to middle-aged animal in same diet condition. c p < 0.05 relative to control diet-fed rats of the same age.

