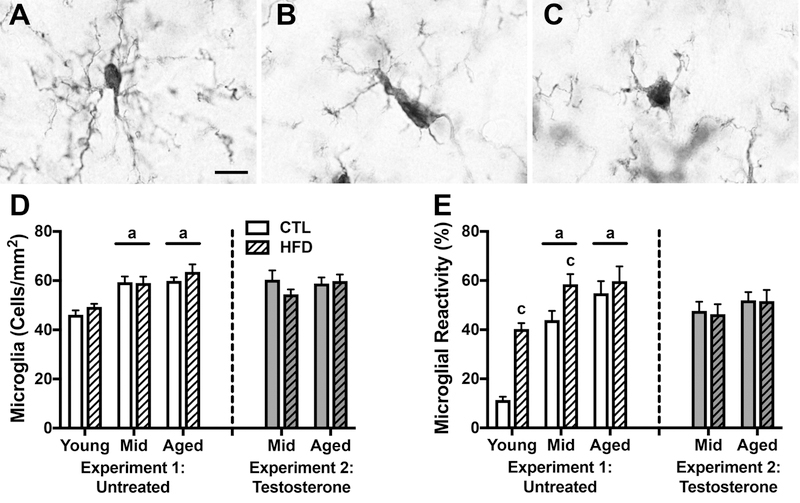
Figure 4.
Microglia number and morphological status as assessed by IBA-1immunohistochemistry in young, middle-aged, and aged brown Norway rats across dietary and testosterone treatments. A-C) Representative images of microglial morphology. Scale bar =10μm. A) A type 1 or resting cell characterized by a small cell body with numerous, ramified projections. Reactive cells are either B) type 2 cells with rod shaped cell bodies and fewer, thicker processes, or C) amoeboid cells with no branches or filopodia. D) Densities of IBA-1immunoreactive microglia in young, middle-aged, and aged rats on control or high fat diet were quantified in hippocampus. E) Percentages of reactive microglia (types 2 and 3) were quantified in hippocampus. Animals not treated with testosterone are shown in white (Experiment 1), and animals treated with testosterone in gray (Experiment 2); control diets are solid white or gray bars, high fat diets are striped bars. a p < 0.05 relative to young rats in same diet condition. c p < 0.05 relative to control diet-fed rats of the same age.

