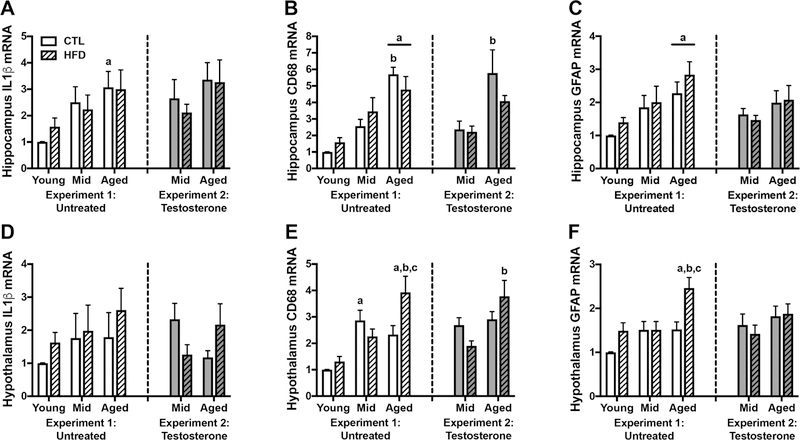
Figure 6.
Inflammatory gene expression in young, middle-aged, and aged brown Norway rats across diet and testosterone treatments. A-C) Relative mRNA levels in hippocampus were determined by qPCR for A) IL1b, a pro-inflammatory cytokine; B) CD68, a microglia/macrophage marker; and C) GFAP, an astrocyte marker. D-F) Relative mRNA levels for D) IL1b; E) CD68; and F) GFAP, were also determined in hypothalamus. Data show fold differences relative to the young rats on control diet. Animals not treated with testosterone are shown in white (Experiment 1), and animals treated with testosterone in gray (Experiment 2); control diets are solid white or gray bars, high fat diets are striped bars. a p < 0.05 relative to young rats in same diet condition. b p < 0.05 relative to middle-aged animal in same diet condition. c p < 0.05 relative to control diet-fed rats of the same age.

