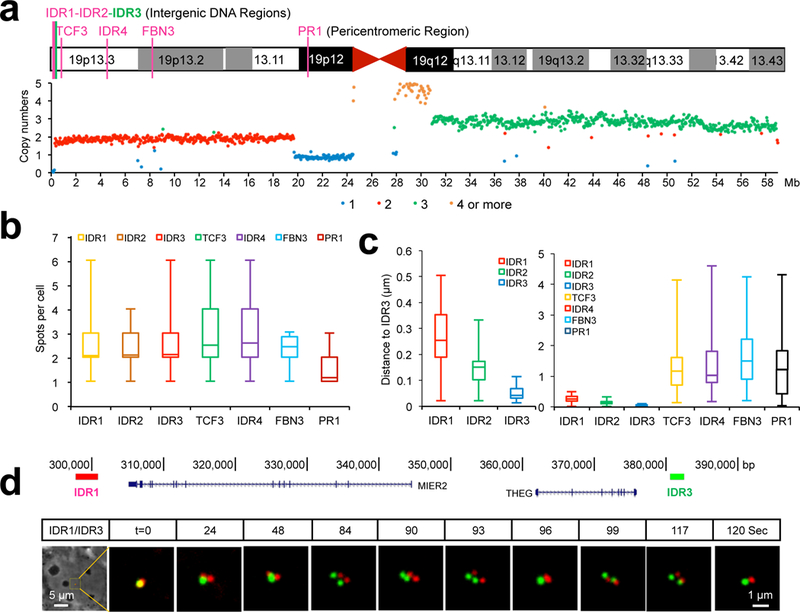
Figure 2. Imaging locus pairs from kilobases to megabases by CRISPR-Sirius.

(a) Schematic of seven unique loci on human chromosome 19 used in this study consisting of 4 intergenic DNA regions (IDRs), 2 intronic regions (TCF3 and FBN3) and 1 pericentromeric region (PR1). Shown beneath chromosome map are the copy numbers of each locus.
(b) Box plot showing the number of foci per cell for the seven loci described above. n=178, 173, 227, 271, 291, 183 and 336 cells from left to right respectively.
(c) Box plot showing the variance of the observed inter-locus distance of each locus pair. n=39 loci for IDR1, 63 loci for IDR2, 24 loci for IDR3, 54 loci for TCF3, 54 loci for IDR4, 78 loci for FBN3 and 53 loci for PR1.
(d) Time lapse of the IDR1/IDR3 locus pair over two minutes. The diagram shows the genomic distance between IDR1 and IDR3 (upper panel). Phase contrast images and dual-color time lapse images were shown in the bottom panel.
