
Figure 2.
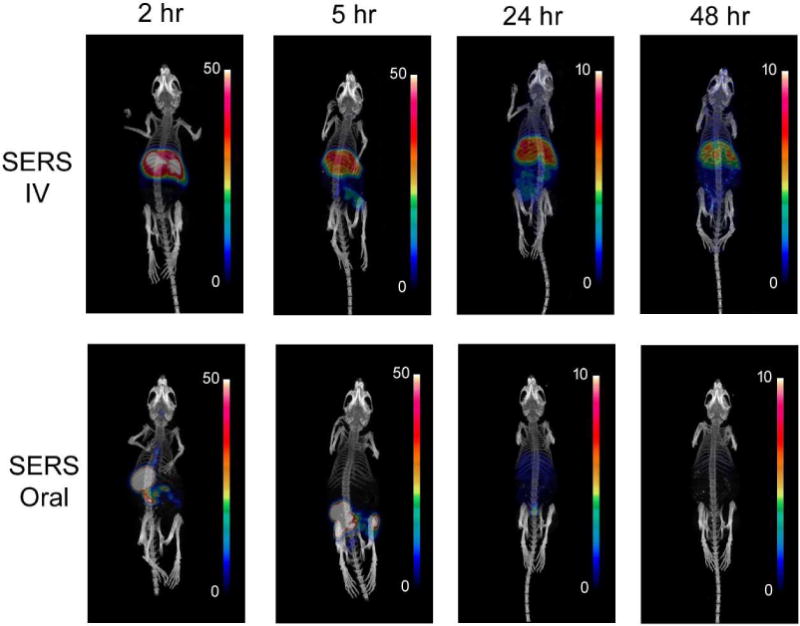
Static microPET images at 2, 5, 24 and 48 hour time points post IV or oral administration of radiolabeled SERS nanoparticles. Scale bar indicates % injected dose per gram (%ID/g) of tissue.
Official websites use .gov
A
.gov website belongs to an official
government organization in the United States.
Secure .gov websites use HTTPS
A lock (
) or https:// means you've safely
connected to the .gov website. Share sensitive
information only on official, secure websites.
Static microPET images at 2, 5, 24 and 48 hour time points post IV or oral administration of radiolabeled SERS nanoparticles. Scale bar indicates % injected dose per gram (%ID/g) of tissue.