FIG. 4.
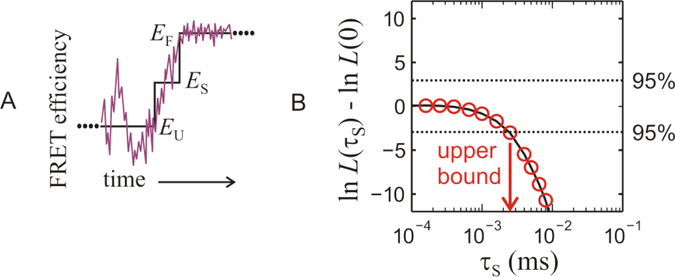
Kinetic model and maximum likelihood analysis of photon trajectories. (A) The noisy curve is a schematic of the instantaneous FRET for a transition path from the unfolded to folded states. The step curve is the simplest discretization of the path with average FRET efficiencies EU for the unfolded state, EF for the folded state, and an intermediate value ES = (EU + EF)/2 for the virtual step state, (B) Comparison of the values of the likelihood function from the three state analysis, L(τS), and a two-state analysis with an instantaneous transition, L(0), calculated for 780 transitions from immobilized molecules. The result of the calculation is that no lifetime greater than 2.5 μs is detected by the measurement, so the average transition path time is shorter than 2.5 μs. Acceptor blinking can interfere with the transition path time analysis [33], but was effectively eliminated by not including transitions in which there are nearby strings of 8 or more donor photons (See the Supplementary Information for details).

