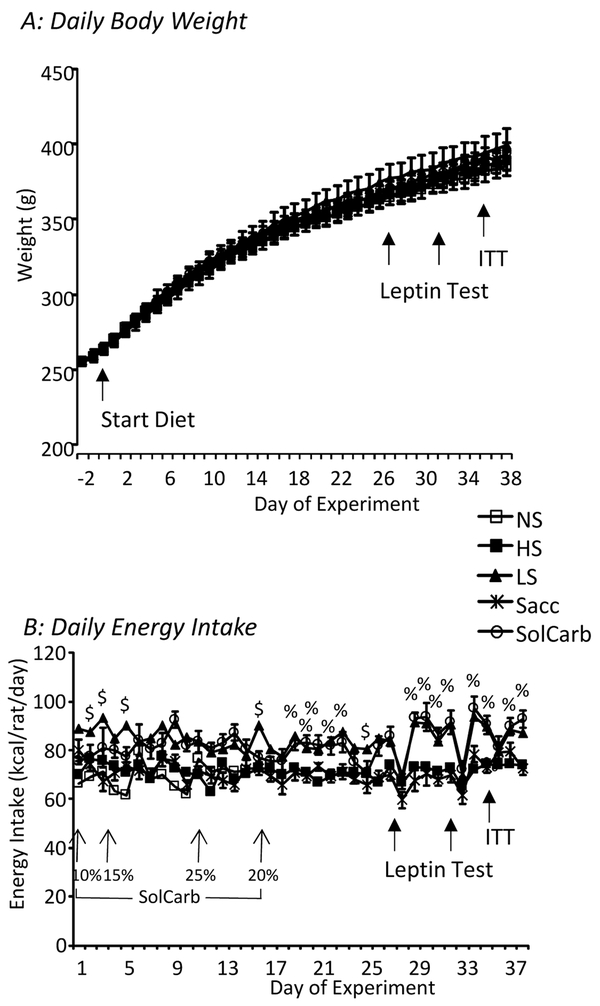
Figure 1:
Daily body weights and energy intakes of the rats during the experiment. There were no differences in body weight of any of the groups at any time during the experiment (Panel A). Daily energy intake (Panel B) of the LS and SolCarb® rats was higher than that of the other groups of rats during the second half of the experiment. % indicates a significant difference between LS and SolCarb® groups and the NS, HS and Sacc groups. $ indicates a significant difference between the LS group and all other animals. Data are means ± SE for groups of 8 rats and were compared by repeated measures analysis of variance and post-hoc Duncan’s Multiple Range test and considered significantly different when P<0.05.

