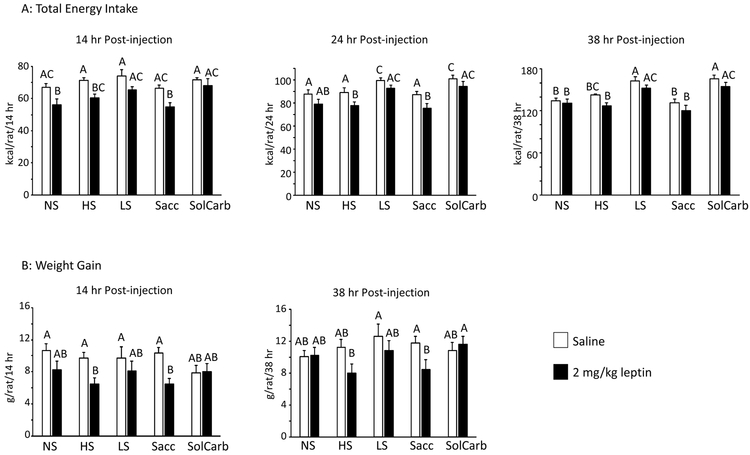
Figure 3:
Leptin response of different groups of rats. Cumulative food intake 14, 24 and 38 hours after injection in the different dietary groups (Panel A). Data are means ± SE for groups of 8 rats. Weight gain at 14 hours and 38 hours after an i.p. injection of PBS or 2 mg/kg leptin given on Days 27 and 32 of the experiment with each rat acting as its own control (Panel B). Values on a specific axis that do not share a common superscript are significantly different at P<0.05 determined by Duncan’s Multiple Range test using rat number as covariant. Energy intake was inhibited by leptin in the NS, HS and Sacc groups, but not the LS or SolCarb® groups.

