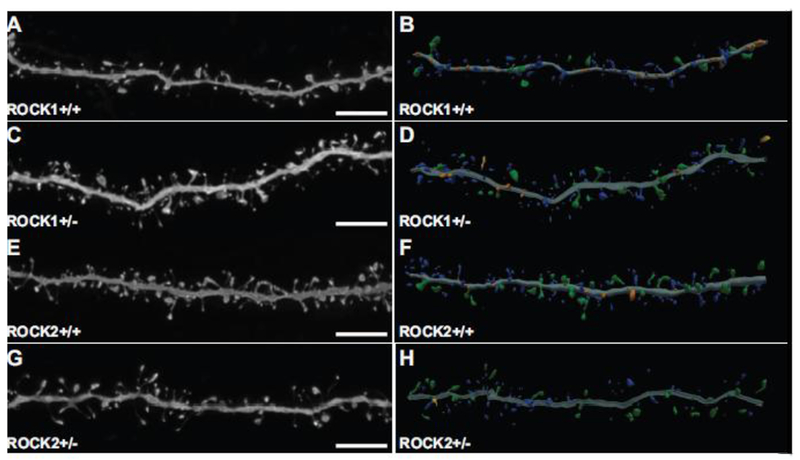
Figure 2.

Representative high-resolution confocal microscope images and corresponding three-dimensional digital reconstruction models of dendrites. (A, C, E, G) Representative maximum-intensity confocal images of dye-filled dendrites after deconvolution. Scale bars represent 5 μm. (B, D, F, H) Three-dimensional digital reconstructions of dendrites depicted on the left. Colors correspond to dendritic protrusion classes: blue represents thin spines; orange, stubby spines; green, mushroom spines; and yellow, dendritic filopodia.
