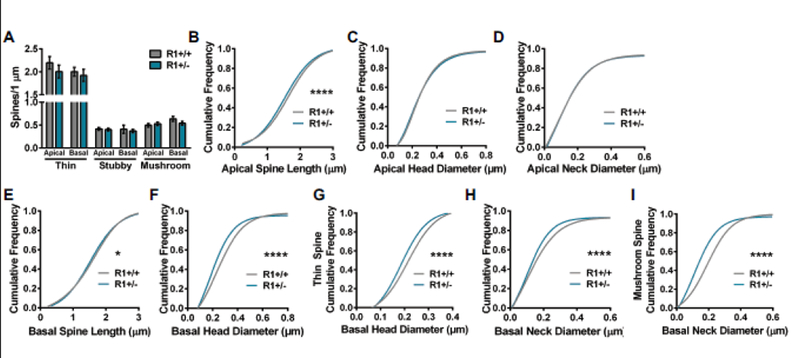
Figure 3.

Comparison of apical and basal spine densities and morphology in ROCK1+/+ (N=36 dendrites from 5 mice) and ROCK1+/− (N=40 dendrites from 6 mice). A. Mean number of thin, stubby, or mushroom spines per 1 μm of apical or basal dendrite was similar between ROCK1+/+ and ROCK1+/−. Bar graphs plot the mean with standard error of the mean. (B-I) The cumulative frequency distributions for individual spines were plotted for each genotype and morphological parameter. Comparison of apical spine distribution plots indicate that ROCK1+/+ and ROCK1+/− segregate based on B apical spine length (Kolmogorov-Smirnov [KS]: D=0.0671, ****p<0.0001); but not C apical head diameter or D apical neck diameter. Comparison of basal spine distribution plots show that genotypes segregate based on E basal spine length (KS: D=0.0465, *P=0.0372); F basal head diameter (KS: D=0.1382, ****P<0.0001); G basal thin spine head diameter (KS: D=0.1304, ****p<0.0001); H basal neck diameter (KS: D=0.0879, ****P<0.0001); and I basal mushroom spine neck diameter (KS: D=0.2416, ****P<0.0001). R1+/+, ROCK1+/+ ; R1+/−, ROCK1+/−.
