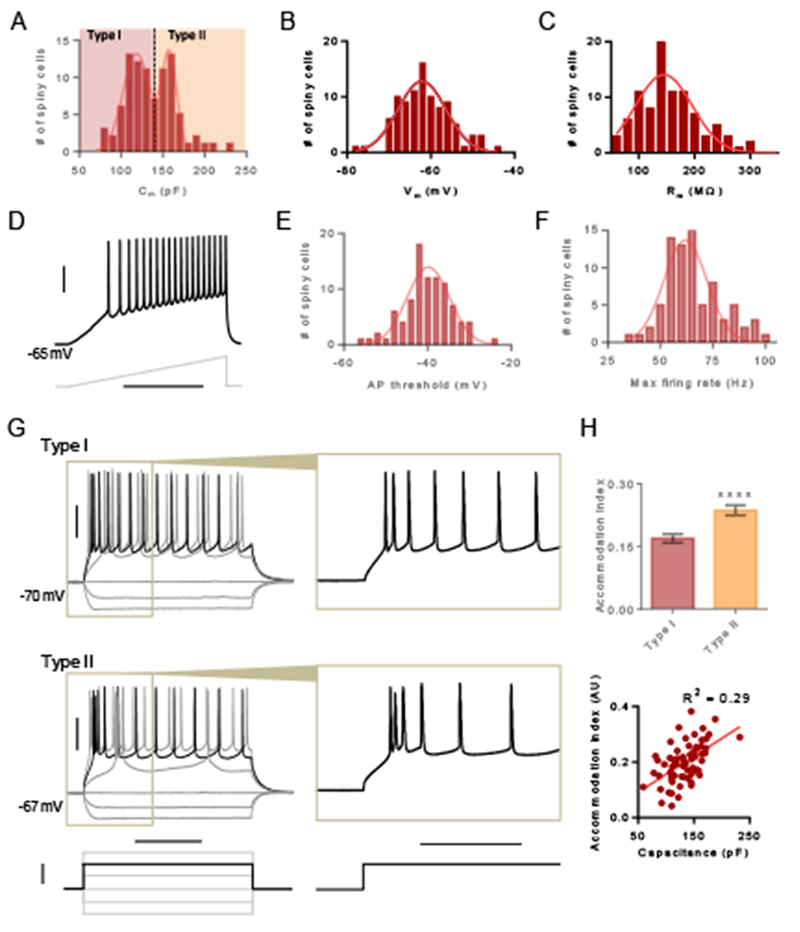
Figure 2. Membrane properties of spiny claustrum neurons delineate two subtypes.

(A) Histogram showing distribution of capacitance for spiny claustrum neurons. Type I neurons were defined as lower capacitance neurons and type II neurons were defined as higher capacitance neurons. (B) Histogram showing the distribution of resting membrane voltage. (C) Histogram showing the distribution of membrane resistance. (D) Representative trace showing a spiny claustrum neuron firing in response to a current injection ramp. (E) Histogram showing the distribution of the action potential (AP) threshold. (F) Histogram showing the distribution of the maximum firing rate. (G) Representative traces showing type I (top) and type II (bottom) responses to various 500 ms current injection steps. Inset of black trace shows pattern of spike accommodation for APs occurring early in the step. (H) Accommodation index (AI) for the first 6 APs was larger for type II neurons compared to type I neurons (top) and AI correlated with capacitance (bottom). Unpaired t test, **** P < 0.0001. Horizontal scale bars = 400 ms (D), 200 ms (G [left]), 100 ms (G [right]). Vertical scale bars = 30 mV (D, G [top]), 200 pA (G [bottom]).
