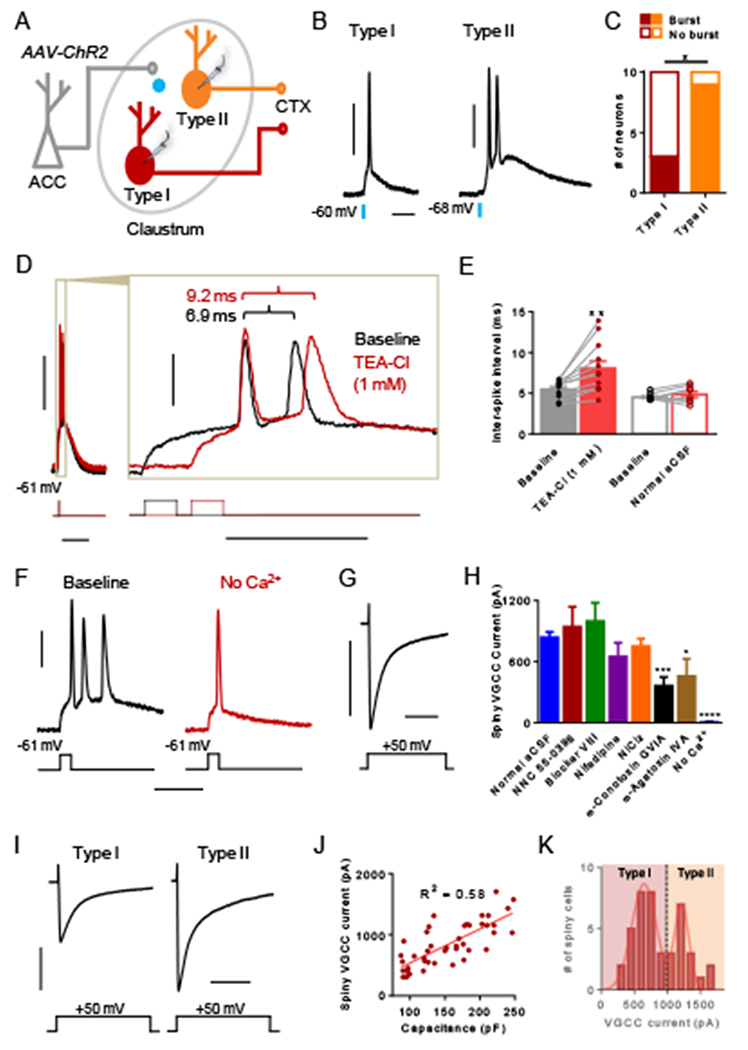
Figure 5. Spiny type II neurons preferentially burst fire in response to ACC input. Burst firing requires calcium and is optimized by voltage-gated potassium channels.

(A) Experimental schematic showing that ACC afferents in the claustrum expressing ChR2 were stimulated optogenetically with 470 nm light while recording responses from claustrum spiny type I and II neurons. (B) Representative traces showing single AP detonation from a type I neuron and an AP burst from a type II neuron in response to ACC afferent stimulation. (C) The proportion of type II neurons that burst fired in response to ACC afferent stimulation was greater than that of type I neurons. (D) Representative traces from a spiny claustrum neuron that burst fires in response to a brief depolarizing current injection (5 ms) in normal aCSF (baseline, black trace) and after washing on TEA-Cl (1 mM, red trace). Inset illustrates that the inter-spike interval (ISI) became longer with TEA-Cl treatment. (E) TEA-Cl treatment (filled red bar) elicited a significantly longer ISI compared to baseline (filled black bar). Washing on normal aCSF (open red bar) did not change the ISI relative to baseline. (F) Representative trace from a spiny claustrum neuron showing that washing on aCSF without Ca2+ (red trace) abolishes burst firing present at baseline (black trace, n = 6 of 6). (G) Representative trace showing voltage-gated calcium channel (VGCC) current elicited in response to a voltage step (−60 to −10 mV). (H) The VGCC current magnitude in control conditions (n = 44) was compared to the magnitude in the presence of various VGCC blockers including NNC 55-0396 (15 μM, n = 8), blocker VIII (20 μM, n = 8), nifedipine (20 μM, n = 11), NiCl2 (50 μM, n = 17), ω-conotoxin GVIA (1 μM, n = 8), ω-agatoxin IVA (200 nM, n = 8), and no Ca2+ (n = 8). (I) Representative traces of VGCC current measured from a type I and a type II spiny claustrum neuron. (J) Capacitance and VGCC current magnitude were significantly correlated for spiny claustrum neurons (R2 = 0.58, P < 0.0001). (K) The distribution for VGCC magnitude was bimodal consistent with lower magnitude VGCC currents measured in type I neurons and higher magnitude currents measured in type II neurons. Fisher’s exact test, * P < 0.05 (C); paired t test, ** P < 0.01 (E); unpaired t test, * P < 0.05, *** P < 0.001, **** P < 0.0001 (H). Horizontal scale bars = 20 ms (B), 100 ms (D [left]), 20 ms (D [right]), 20 ms (F), 200 ms (G, I). Vertical scale bars = 30 mV (B, D, F), 500 pA (G, I).
