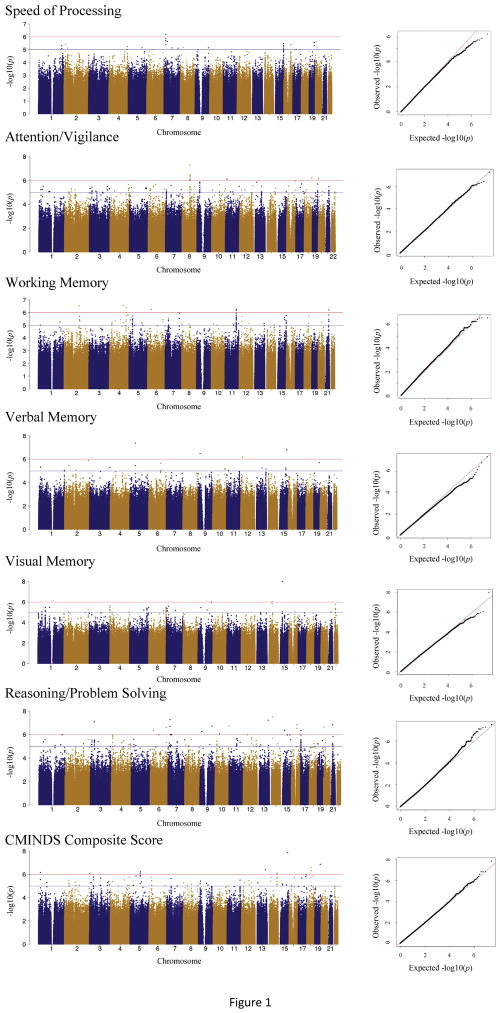
Figure 1.
GWAS Manhattan and QQ Plots for each Cognitive Domain. The Manhattan plots display the association p-value for each SNP in the genome (displayed as −log10 of the p-value). Red and blue lines display p=1×10⁻⁶ line and p=1×10⁻⁵ respectively. Quantile-quantile plot for the empirical and theoretical distributions are shown as black and red lines, respectively.

