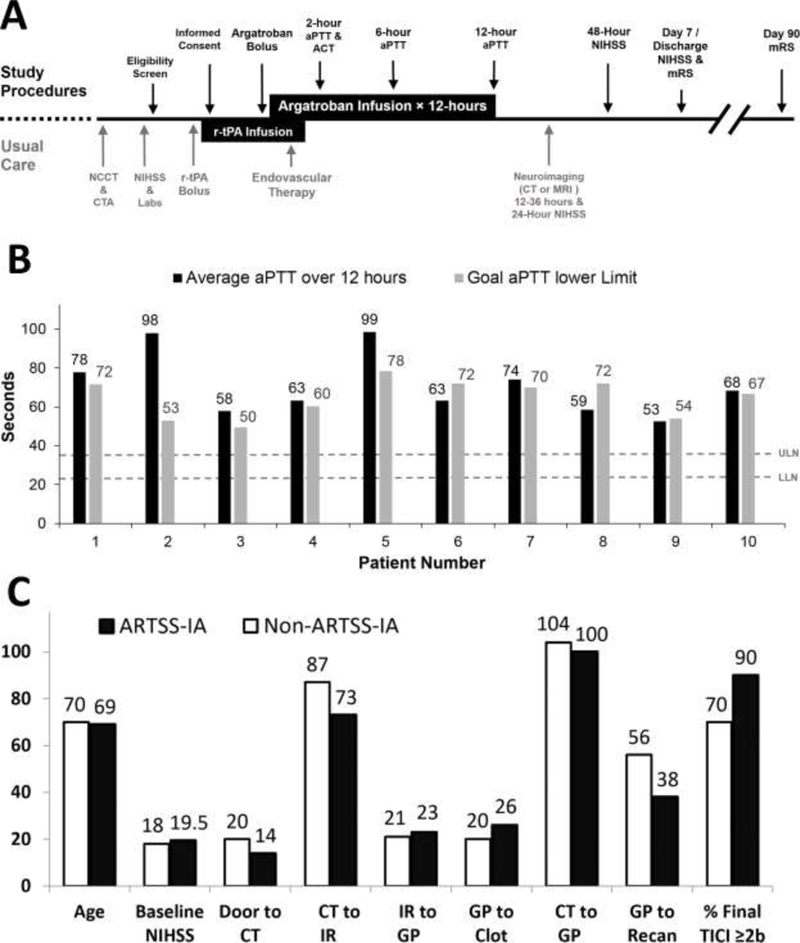
Figure:

Panel A. Study schedule of observations and procedures. Panel B. Average aPTT lab values over 12 hours of Argatroban infusion. Dashed lines represent laboratory reference range for normal aPTT values - upper limit of normal (ULN - 36secs) and lower limit of normal (LLN - 23secs). Panel C. EVT procedural timing data. Abbreviations: ACT-Activated Clotting Time; CT- Computed Tomography; IR-Interventional Radiology suite; GP-Groin Puncture; Recan- Recanalization.
