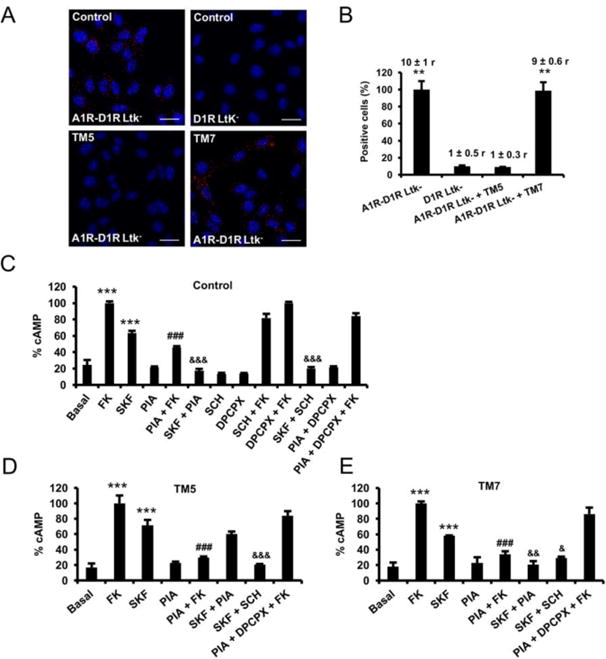
Figure 2. A1R-D1R heteromer expression and adenylyl cyclase signaling in fibroblast Ltk- cells.

In (A and B), Ltk- cells expressing A1R and D1R (A1R-D1R Ltk) or only D1R as negative control (D1R Ltk-) were treated for 4 h with vehicle or with 4 μM of D1R TM5or TM7 peptides before performing proximity ligation assays. In (A), confocal microscopy images (superimposed sections) are shown in which heteromers appear as red spots in vehicle and TM7 treated cells and not in cells treated with TM5 peptide or in the negative control. In all cases, cell nuclei were stained with DAPI (blue). Scale bars = 20 μM. In (B) the percentage of cells showing spots related to the total cells determined as stained blue nuclei is given in each case as well as the ratio (r) between the number of red spots and cells showing spots (top columns). Values are mean ± S.E.M. of n = 8-16; **: p < 0.01 as compared with D1R Ltk-cells (one-way ANOVA followed by Dunnett's comparisons). In (C-E), A1R-D1R Ltk- were pre-treated for 4 h with vehicle (C) or with 4 μM of D1R TM 5 (D) or TM 7 (E) peptides. Cells were then treated for 10 min with vehicle or with A1R antagonist DPCPX (1 μM) or the D1R antagonist SCH23390 (1 μM) prior being stimulated with medium, the A1R agonist R-PIA (100 nM) or the D1R agonist SKF38393 (200 nM) in the absence or in the presence of 20 μM forskolin (FK). Values are mean ± S.E.M. of n = 4–5 and are expressed as percentage of FK treated cells in each condition (100% represents 80-100 pmols cAMP/106 cells) ***: p < 0.001 versus basal; ###: p < 0.001 versus FK; &&&, && and &: p < 0.001, p < 0.01 and p < 0.05 versus SKF38393, respectively (one-way ANOVA followed by Bonferroni's comparisons).
