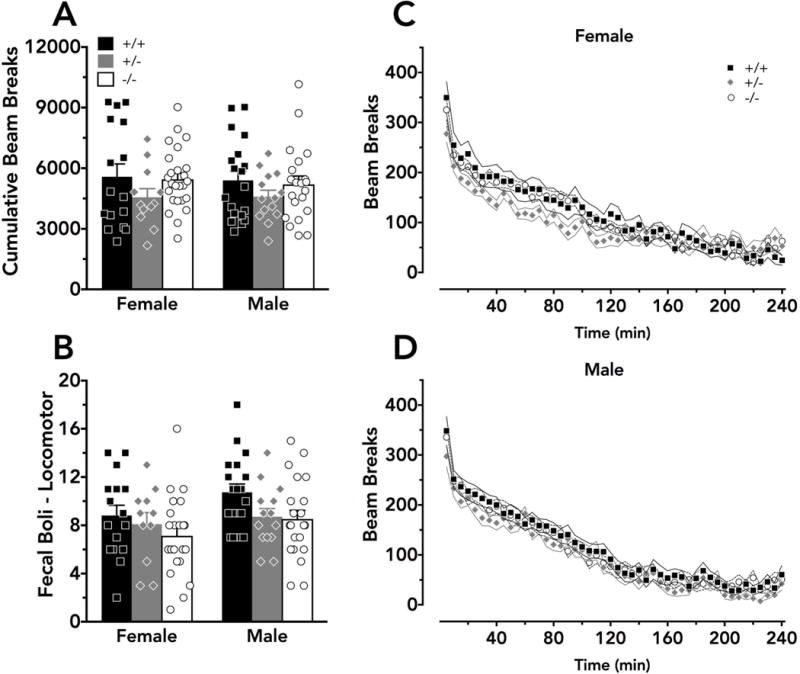
Figure 2. Locomotor activity is unaltered by PMAT deficiency.

Locomotor activity was measured in 5 min bins by infrared beam breaks over a 4 h consecutive span. A) Cumulative beam breaks did not differ across sex or genotype. Significant main effects of sex and genotype were detected for B) fecal boli measured at the conclusion of the locomotor activity assay, but no significant differences were indicated by Dunnett’s post-hoc tests. A significant interaction between sex and time on locomotor activity was detected, and graphs are separated into C) female and D) male data for clarity. A,B) Means + S.E.M. for wildtype mice are indicated as black bars, heterozygous mice as grey bars, and knockout mice as white bars, with individual data points indicated by black squares (wildtypes), grey diamonds (heterozygotes), or white circles (knockouts). C,D) Means ± S.E.M. for each time bin, starting at 5 min, are indicated by black squares and solid black lines (wildtypes), grey diamonds and solid grey lines (heterozygotes), or white circles and dashed black lines (knockouts). Ns for all graphs are: wildtypes - female N=16, male N=19; heterozygotes - female N=12, male N=14; knockouts - female N=25, male N=21; except in b N=11 for heterozygous female and N=22 for knockout female because fecal boli counts were not recorded for 4 animals.
