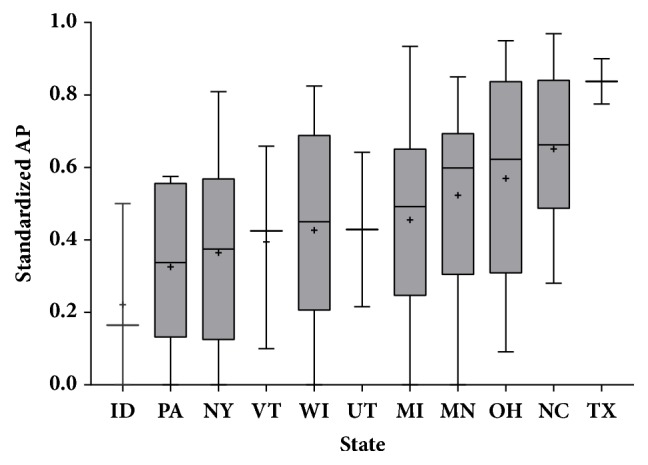
Figure 3.

Distribution of standardized AP by state; significant ANOVA (p=0.025); no significant pairwise comparisons. For boxplots: + symbol=mean, midline=median, shaded box=interquartile range (where n>3), whiskers=min and max.

Distribution of standardized AP by state; significant ANOVA (p=0.025); no significant pairwise comparisons. For boxplots: + symbol=mean, midline=median, shaded box=interquartile range (where n>3), whiskers=min and max.