
Table 5.
Spectral analysis and quantification of compounds in the precipitate from C. roseus.
| Compound | Retention time (min) | % in the sample | Spectral signal (sample) | Spectral signal (standard) |
|---|---|---|---|---|
| Gallic acid | 14.19 | 0.053 |
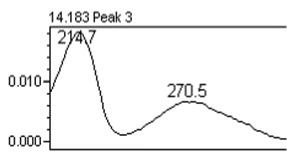
|
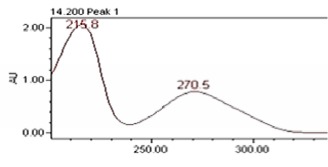
|
| Chlorogenic acid | 20.15 | 0.216 |
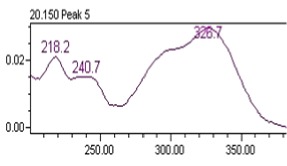
|
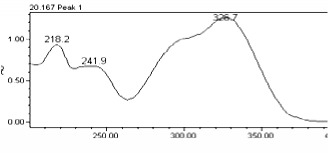
|