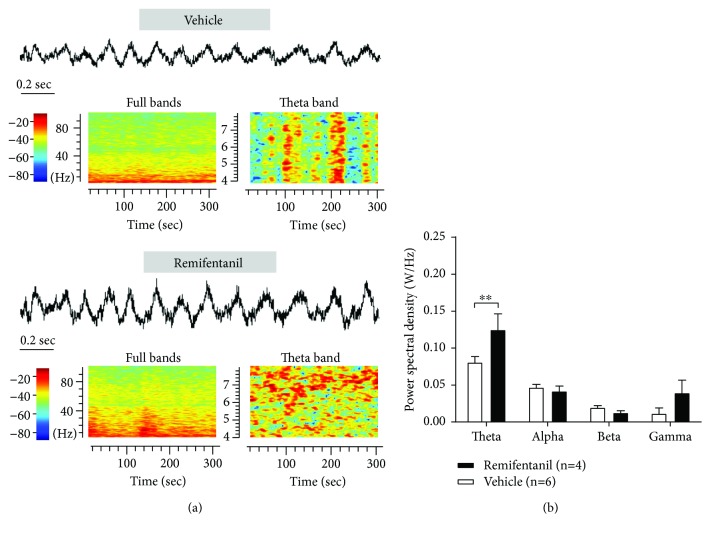
Figure 5.
Effects of RF infusion on the activity of VPL LFP in rats. (a) An example of the LFP and the time-frequency representation in the vehicle- and RF-treated rats on day 3 post-RF infusion. Representatives of 4~100 Hz (left) and 4~8 Hz (right) frequency bands of LFP from the vehicle and RF groups are shown. The power spectra are normalized. Warm and cool colors indicate the increase and decrease, respectively, in field potential power of VPL LFP. (b) Summary of the power spectral density of theta, alpha, beta, and gamma bands on day 3 after RF infusion. Note that RF infusion induces a significant increase in activity of low-frequency theta (4–10 Hz) band but not alpha, beta, and gamma bands in VPL LFP. ∗∗P < 0.01 versus the corresponding vehicle group, two-way ANOVA followed by the Bonferroni post hoc test, n = 4 to 6 rats per group.

