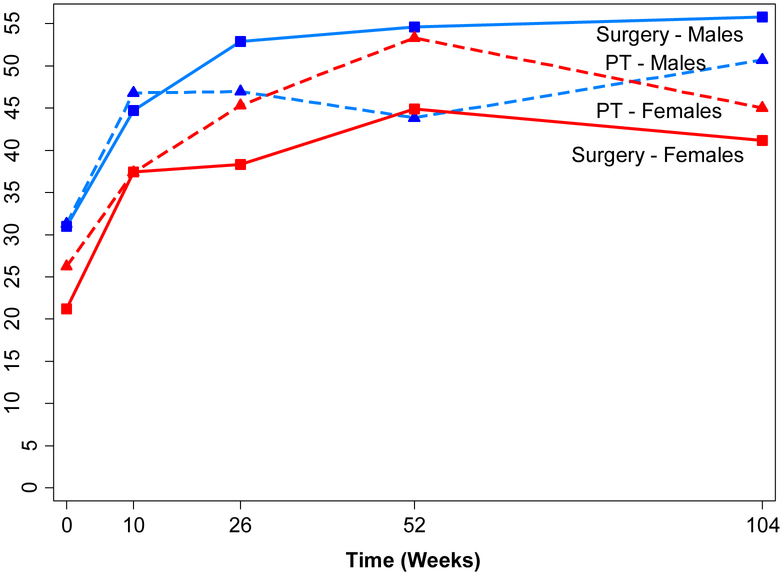
Figure 3. Adjusted Means for Physical Function over Time by Treatment and Gender using Intention to Treat Analyses.
Adjusted means of physical function scale of the Short Form-36 (SF-36) for the surgery (solid lines) and physical therapy (dashed lines) groups by gender (male = blue lines; female = red lines) over time from linear mixed models (adjusted for surgeon and baseline age). Three-way interaction for gender*group*time p=0.066; group*time within men p=0.10; group*time within women p=0.50.
SF-36 scale ranges from 0 to 100, with lower scores indicating more severe symptoms.
PT stands for Physical Therapy.

