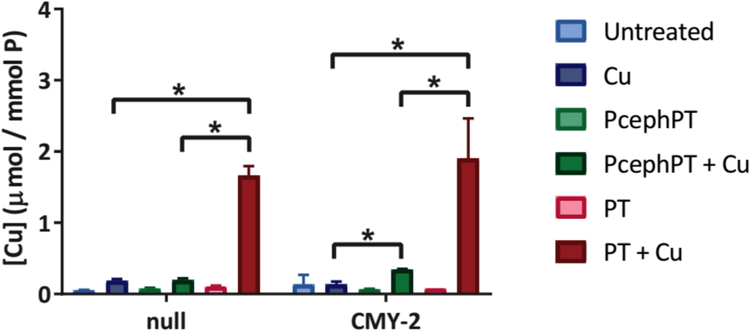
Figure 5. ICP-MS data comparing cell-associated Cu content of MG1655 null and CMY-2 strains treated for 15 min with PT or PcephPT, with and without Cu.
Cu concentration was normalized to phosphorous content for each sample. Treatment conditions: 4 μM PcephPT, 4 μM PT, 10 μM CuCl2. * indicates p < 0.05 using one-tailed Student’s t-test.

