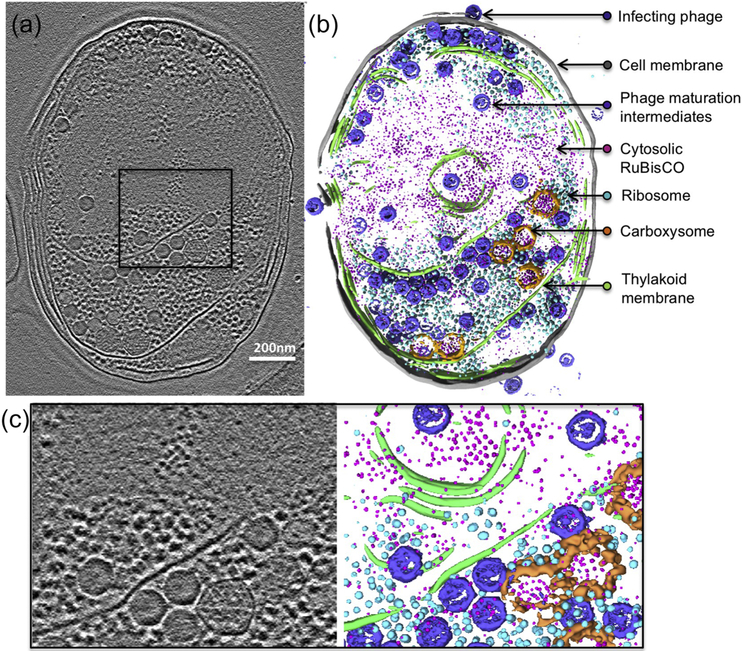
Figure 1. Zernike phase contrast cryoET enables direct visualization of subcellular structures in Synechococcus sp. WH8109 cells.
(a) A 54Å slab taken from a WH8109 cell tomogram. (b) Volume rendering of the entire cell tomogram shown in (a). Carboxysome shell is segmented and colored in orange. RuBisCO complexes are colored in magenta. (c) Zoom-in view of the region boxed in (a).

