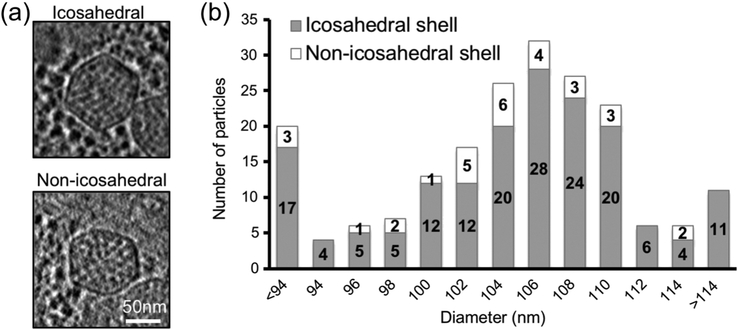
Figure 4. Carboxysome size distribution and the numbers of icosahedral and non-icosahedral particles in each size group.
(a) Central slabs of 54 Å of representative icosahedral and non-icosahedral particles. (b) Carboxysome size distribution histogram including both non-symmetric and icosahedral particles in each size group. Intracellular carboxysome subtomograms were classified into various size groups based on their diameters by radial density plotting.

