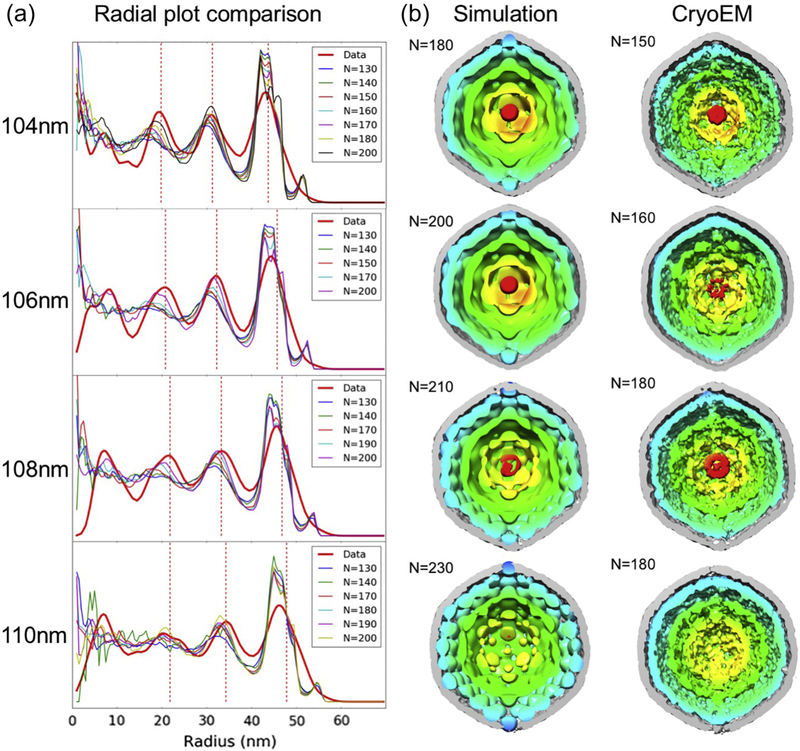
Figure 6. Molecular dynamic simulation vs experimental subtomogram averages of carboxysomes.
(a) Radial density plots of individual carboxysome simulations with variable numbers of RuBisCO (N) enclosed were compared to those of experimental subtomogram averages (red line). The red dashed lines denote the locations of the density peaks in the radial density plots. The cross sectional views of best matching simulation maps were shown with corresponding subtomogram average maps in (b).

