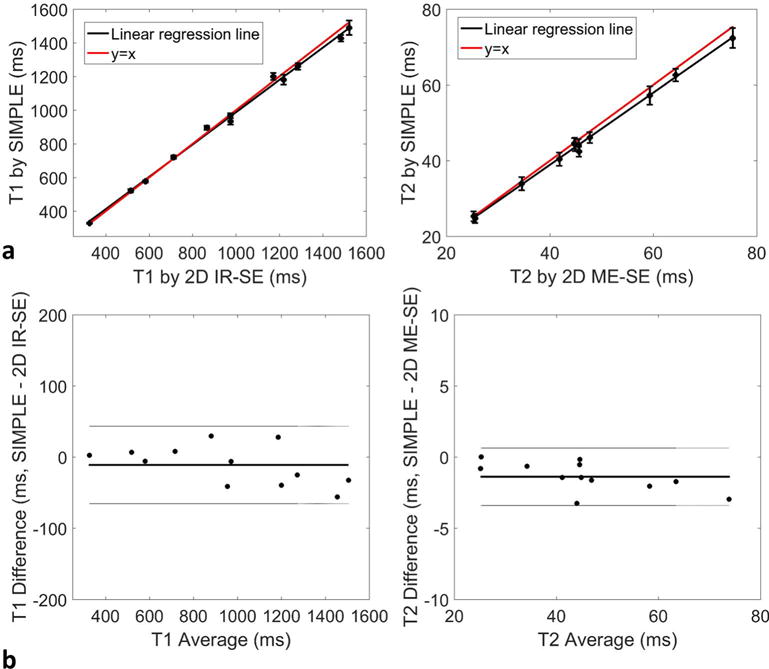
FIG. 3.

a: Comparison of T1 and T2 measurements of phantoms between SIMPLE and 2D standard spin echo methods with mean and SD shown. The black line indicates the linear regression line, and the red line represents y=x. b: Bland-Altman plot showing the difference between the two methods with the mean value. The solid line indicates the average difference, and the dotted lines indicate the 95% confidence intervals for T1 and T2.
