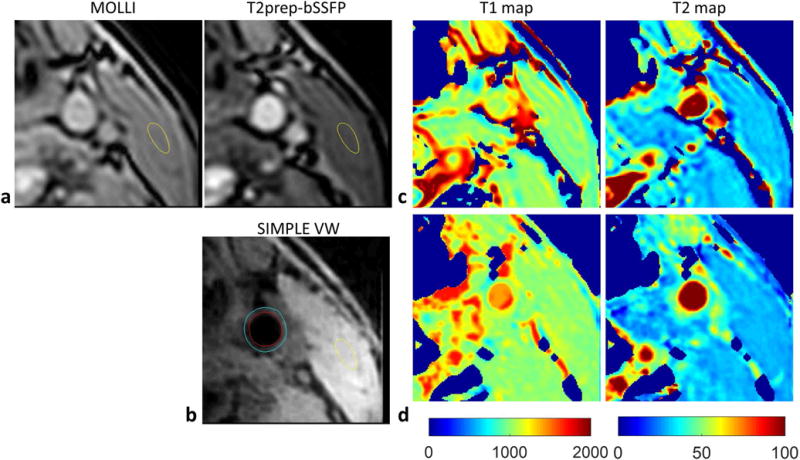
FIG. 4.

Carotid artery T1 and T2 mapping of a healthy volunteer. a, b: The MOLLI, T2prep-bSSFP images, and the black-blood vessel wall images reconstructed from SIMPLE. The yellow contour indicates the ROI of muscle, and the blue and red contour indicates the ROI of outer wall and lumen. c: The T1 and T2 maps measured using MOLLI and T2prep-bSSFP methods. d: The T1 and T2 maps estimated by SIMPLE.
