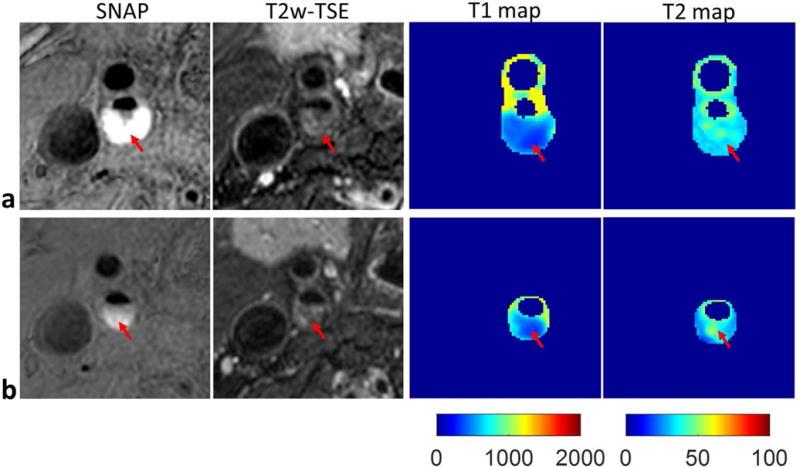
FIG. 5.

Carotid artery T1 and T2 mapping of an atherosclerotic plaque (male, 61 years old) by SIMPLE. Two representative slices were shown (a, b), including the SNAP, T2w-TSE images and the T1, T2 maps estimated by SIMPLE. The red arrow indicates the IPH region. Lower T1 values and no obvious alterations of T2 values were found in the IPH, which were in agreement with the SNAP and T2w-TSE images, respectively.
