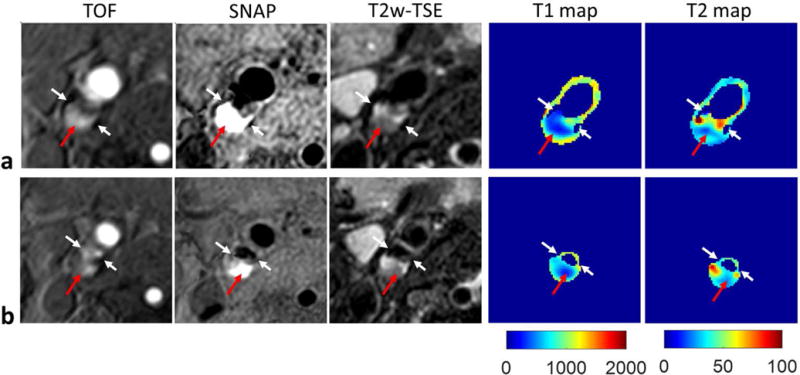
FIG. 6.

T1 and T2 mapping of one carotid plaque (male, 72 years old) with both IPH and calcification by SIMPLE. The TOF, SNAP and T2w-TSE images, and the T1, T2 maps generated by SIMPLE from two slices of the plaque are shown in a, b, separately. The white arrows indicate the calcification, and the red arrows indicate the IPH region. Compared with surrounding region, lower T1 values were observed in the IPH region, while higher T2 values were only observed in a portion of IPH. The T1 and T2 of calcification cannot be reliably fitted, and were set to be zero.
