
Figure 1. Ca2+ buffering by the Ca2+ sensor fura-2 in chromaffin cells.
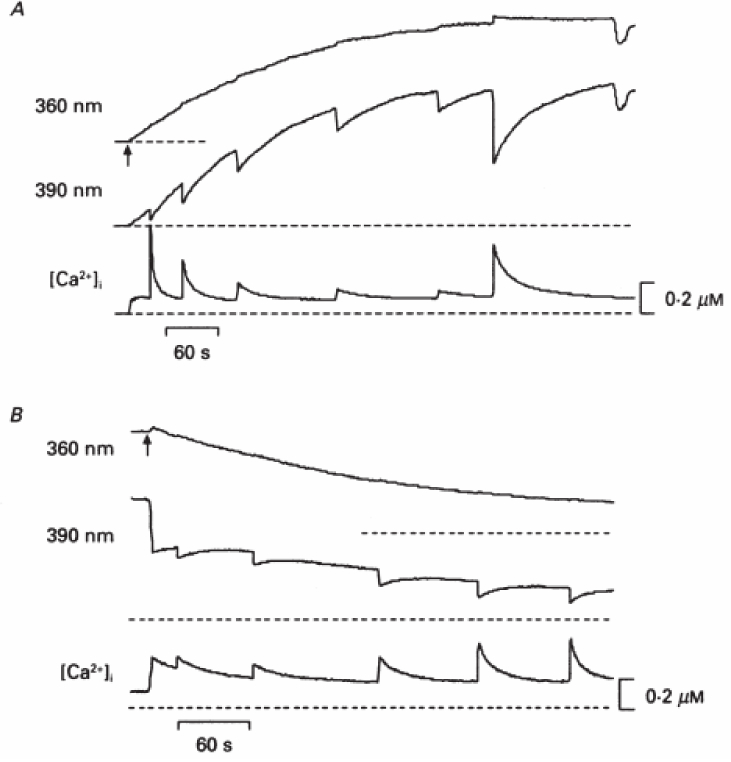
A. In a patch clamped chromaffin cell, the fluorescence of the dye is excited with two different wavelengths nearly simultaneously by rapid switching between excitation filters. The fluorescence at the Ca2+-independent wavelength (360 nm, top trace) gives the time course of fura-2 loading into the cell. Voltage pulses of 50msec from −70 mV to 10mV were applied at irregular intervals during the loading, and dips in the Ca -sensitive wavelength (390 nm, middle trace) reported Ca rises. The final fluorescence change was elicited by a longer voltage pulse of 500 msec. The intracellular free Ca2+ concentration, [Ca2+]i, computed from the ratio of fluorescence elicited by the two wavelengths (bottom trace), illustrates the decrease in amplitude of the [Ca2+]i rise and increase in decay time as [fura-2] in the cell rises to a final concentration of 400 µM. B. After removing the patch electrode containing 400 µM fura-2, a second recording was made from the same cell using a patch pipette containing 50 µM fura-2. The decline in fluorescence at 360 nm tracked the reduction in fura-2 concentration. As the dye concentration fell, the Ca2+ rises evoked by 20msec pulses became larger and the decays became more rapid. Extracellular Ca2+ was 5mM. Reproduced with permission from Ne her and Augustine, 1992 [4].