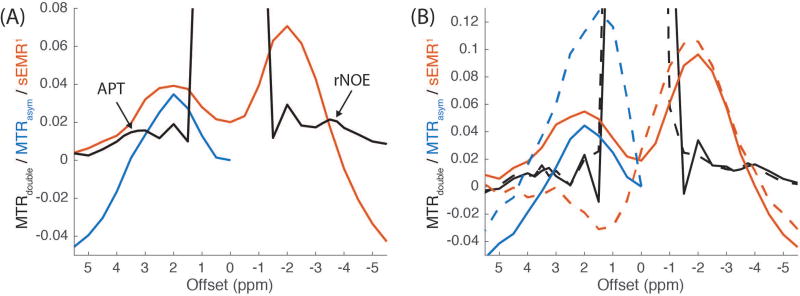
Figure 3.
The comparisons of MTRdouble (black), MTRasym (blue) and sEMR1 (red) (A) and their changes corresponding to B0 correction (B). The results with and without WASSR B0 correction are shown in solid and dashed lines, respectively. The signals in (A) were averaged from WM in six healthy subjects, and the signals in (B) were averaged from WM of a single subject. MTRdouble was obtained with a 0.5 µT average power and a 30% duty cycle. The results show that MTRdouble has (1) a much flatter and smaller baseline, (2) much more distinct and visible peaks at the exchange sites (see arrows at 3.5 and −3.5 ppm), and (3) less sensitivity to B0 inhomogeneity than do MTRasym and sEMR1.

