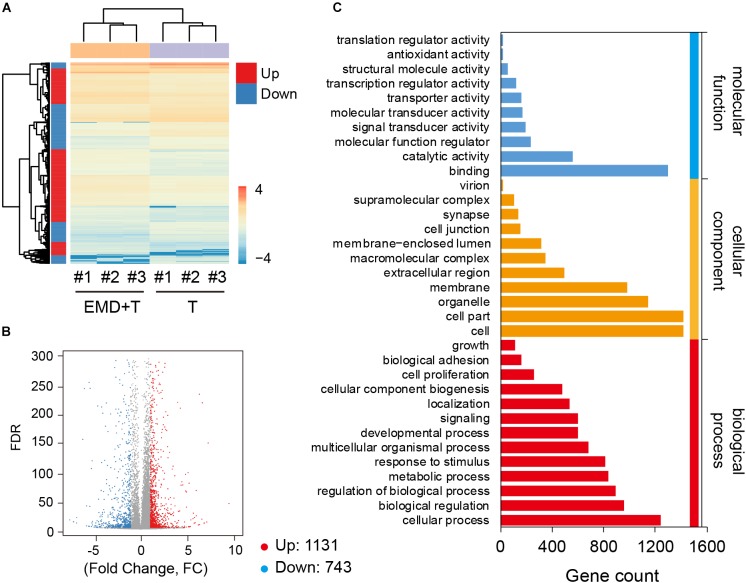
FIGURE 3.
Global gene expression profiles under the TNF-α conditioned culture with or without EMD. (A) Heatmap for global gene expression, # indicates number, experiment repeated three times, n = 3; (B) Volcano map of TNF-α and TNF-α plus EMD expression genes, FC (fold change) > 1 was accepted as positive differentially expressed genes, up for 1131; down for 743. (C) GO enrichment of those selected DEGs including biological process, cellular component, molecular function.

