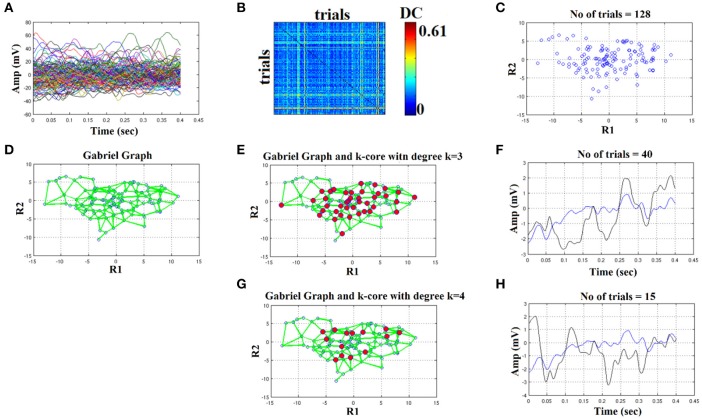
Figure 5.
Butterworth IIR order 2: Outline of the proposed graph-based methodology (High intensity condition—deviant). (A) Plot of single trials from a single subject. (B) Similarity matrix that tabulates the pair-wise associations of single-trials with distance correlation metric. (C) Embedding the similarity matrix in (B) in a 2D space with multidimensional scaling (MDS) algorithm where every blue dot represents a single-trial. (D) Construct the Gabriel graph (GG) based on the 2D positions of the single trials. Green lines represent the connections under the notion of GG. (E) Detection of hubs-representative single-trials based on their degree k in the GG. Here, we selected k = 3 to detect the single trials representing with red circles. (F) Characteristic grand-averaged single-trial derived from the averaging of the selected hubs/single trials (red circles) in (E). We selected 40 signals from 128 trials. Blue waveform denotes the grand-average from the whole set of trials while the black from the selected single-trials. (G) Detection of hubs-representative single-trials based on their degree k in the GG. Here, we selected k = 4 [compared to 3 in (E)] to detect the single trials representing with red circles. (H) Characteristic grand-averaged single-trial derived from the averaging of the selected hubs/single trials (red circles) in (G). We selected 25 signals from 128 trials. Blue waveform denotes the grand-average from the whole set of trials while the black from the selected single-trials. Amplitude and latency are estimated in the grand-averaged based on the global maxima.

