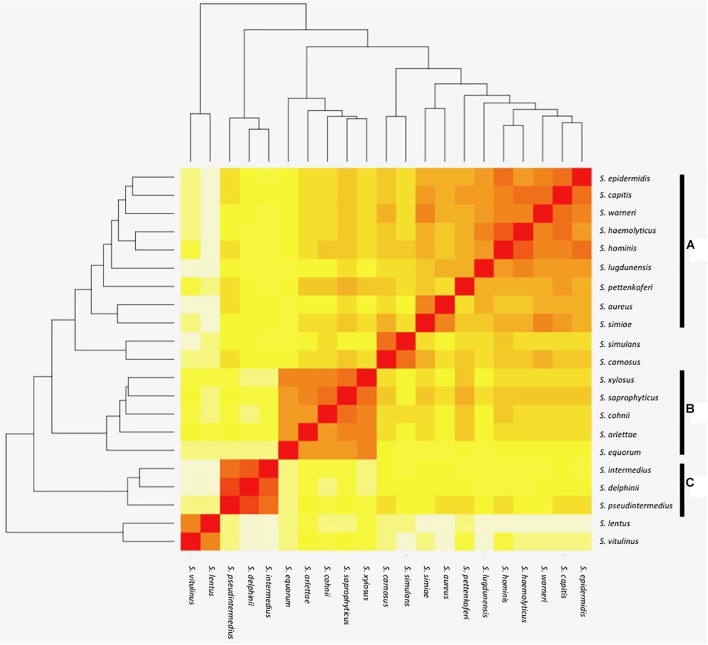
FIGURE 1.
Heat map representation of shared orthologous proteins across Staphylococcus species. Presence is indicated using a color scale from red (highest number of shared clusters of orthologous proteins) to white (lowest number). Major groups of species observed in the analysis are highlighted as groups A–C.

