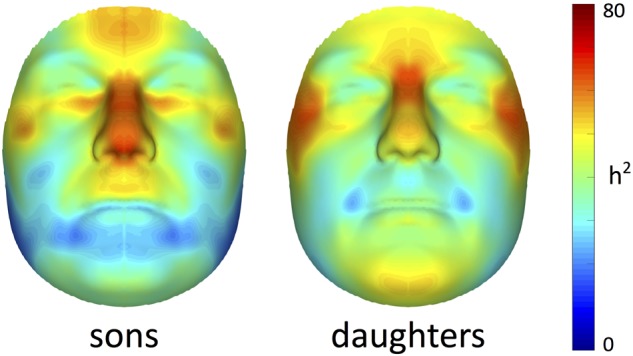
FIGURE 1.

Facial heritability maps. 3D landmark heritability (%) for sons and daughters as obtained from the regression on fathers. The red-blue spectrum represents regions of high and low heritability, respectively. The maximum value was set to 80% for visualization purposes.
