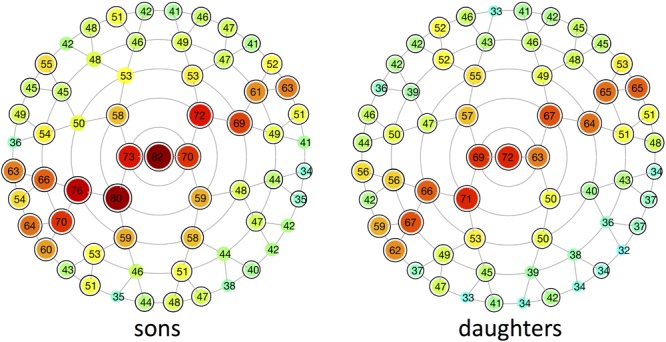
FIGURE 4.

Heritability of different global-to-local parts in the face. Modular heritability estimates (%) for sons and daughters, as obtained from the regression on fathers. Each node corresponds to the facial segments depicted in Figure 3. The red-blue spectrum represents levels of high and low heritability, respectively, and the corresponding values are plotted on top of each node. Black-encircled facial segments had p-values below the significance threshold correcting for the multiple-testing burden (α = 1.3889 × 10⁻³). All significance tests were based on 1,000,000 permutations.
