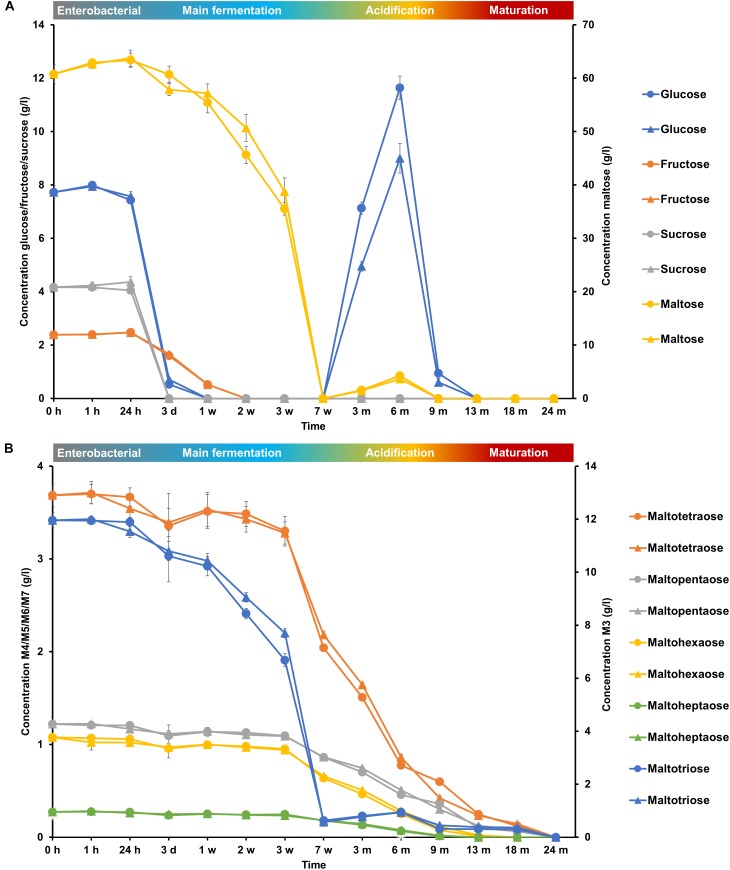
FIGURE 6.
Consumption of (A) glucose, fructose, sucrose, and maltose and (B) maltotriose (M3), maltotetraose (M4), maltopentaose (M5), maltohexaose (M6), and maltoheptaose (M7) during the 24-month lambic beer production processes carried out in two identical oak casks. Since no differences were found regarding substrates and metabolites for the different sampling heights (top, middle, and bottom of the fermenting wort and maturing beer in the casks), average concentrations are reported. In the case of glucose, fructose, sucrose, maltose, and maltotriose, the averages were taken of the concentrations in the fermenting wort and maturing beer measured at the top, middle, and bottom of the same casks during the same lambic beer production processes reported before (De Roos et al., 2018). Standard deviations represent technical replicates. Cask 1 ( ) and cask 2 (
 ).
).

