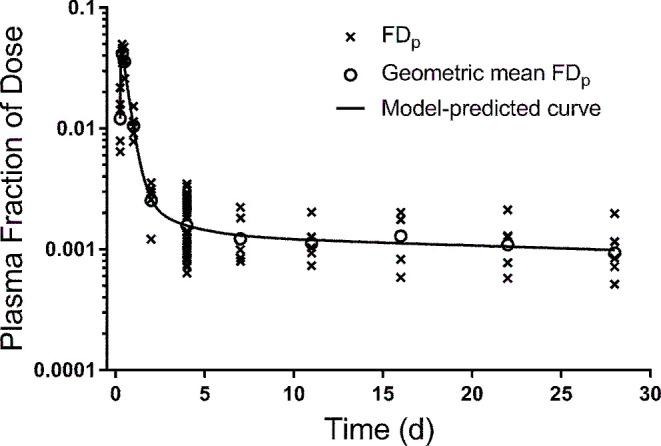
FIGURE 4.

Model-simulated composite plasma retinol response data vs. time after ingestion of labeled retinyl acetate for 50 theoretical subjects generated using the super-child protocol. Shown are “observed” FDp for individual subjects (50 subjects at 4 d and 5 randomly assigned children at each remaining time), the geometric mean FDp at each time, and the model-calculated fit to the mean data for 1 of the 5 super-child data sets (protocol 3/scenario 5). FDp, fraction of dose in plasma.
