
FIGURE 5.
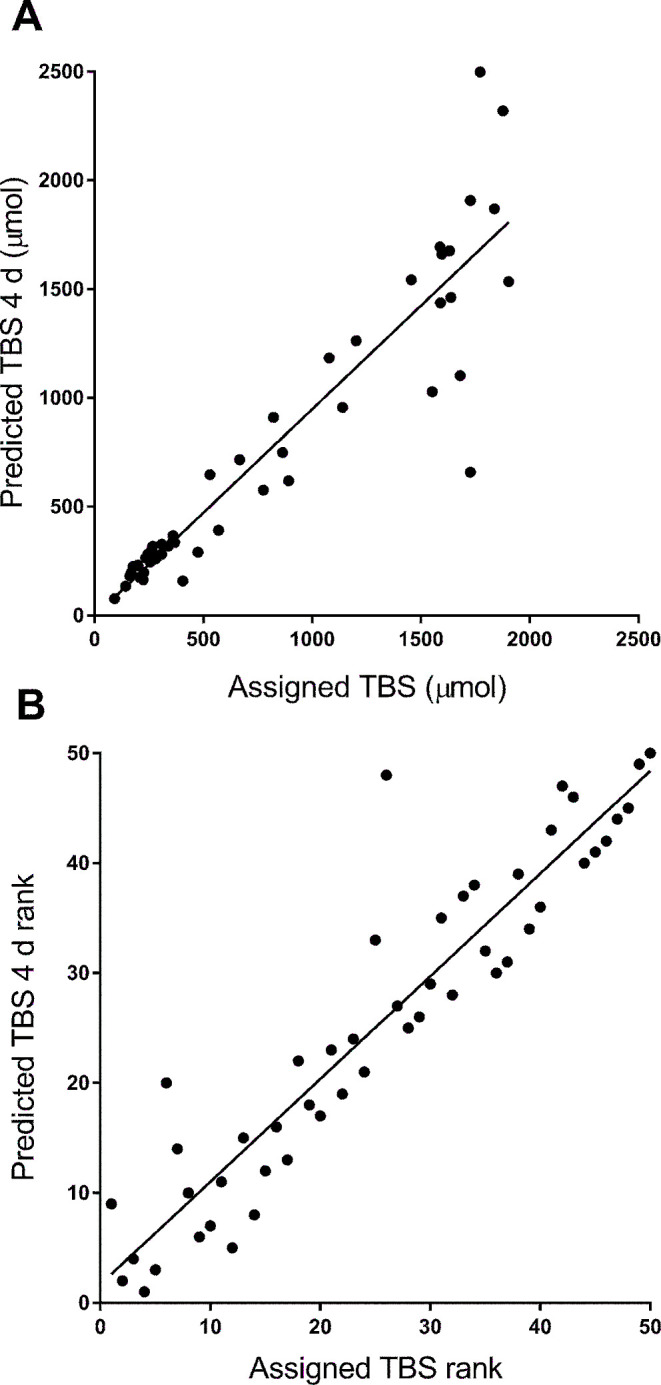
Assigned compared with predicted values for vitamin A TBS for 50 theoretical subjects (A) and rank-order of values (B). TBS was predicted using retinol isotope dilution (Equation 2) at 4 d for 1 of the 5 super-child data sets (protocol 3/scenario 5); least-squares regression lines were y = 0.95x − 4.1 (R2 = 0.86, P < 0.0001) (A) and y = 0.93x + 1.7 (Rs = 0.93, P < 0.0001) (B). TBS, total body stores.