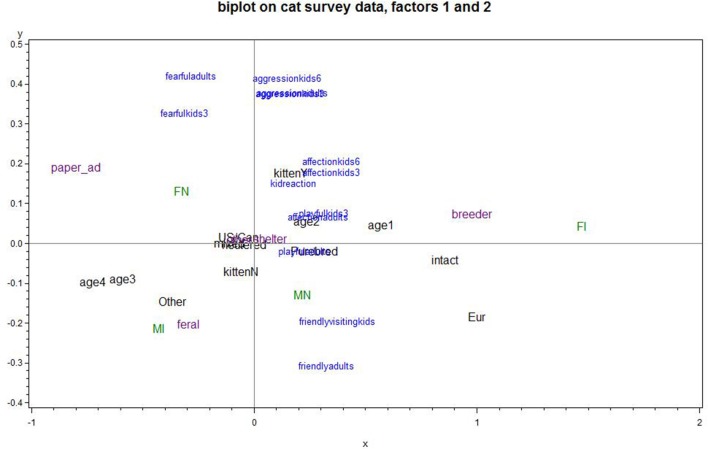
Figure 1.
Biplot of Factor 1 cat's positive interactions and factor 2 cat's fearfulness/aggression (Factor 1 increases to the right; Factor 2 increases going up. Lower right quadrant is the optimal relationship; e.g., intact cats were better for positive interactions than neutered females; cats from a breeder provided more positive interactions than those from an ad; ferals scored low on fearfulness/aggression; cats in Europe scored better on these two factors than those scored in the U.S./Europe). Points plotted in blue represent the variables that were used in the PCA. Points plotted in green, purple or black place subgroups of responses on the graph, corresponding to neuter/gender status, cat source, and miscellaneous categorical predictors, respectively. Points that plot in the same general direction relative to the origin are positively associated, while ones that plot on opposite directions are negatively associated. The strength of an association is related to the distance from the origin, so the points closest to the origin exhibit negligible associations.

